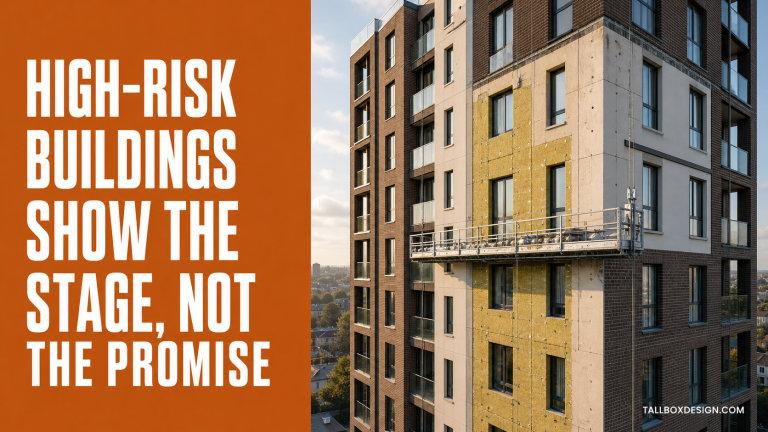
U.S. architects entered Q3 2026 with an expectation index of 71, up 13 points in one quarter. Yet their reported project backlog shortened to 5.1 weeks, so confidence is rising faster than the queue of work waiting to start.
Houzz Research’s Q3 2026 industry barometer surveyed 180 architects and 343 interior designers from July 2 to July 8. The survey tracks directional expectations, recent activity, and wait times, which makes it useful for reading momentum but not for forecasting an individual firm’s revenue.
What does the architect expectation index of 71 measure?
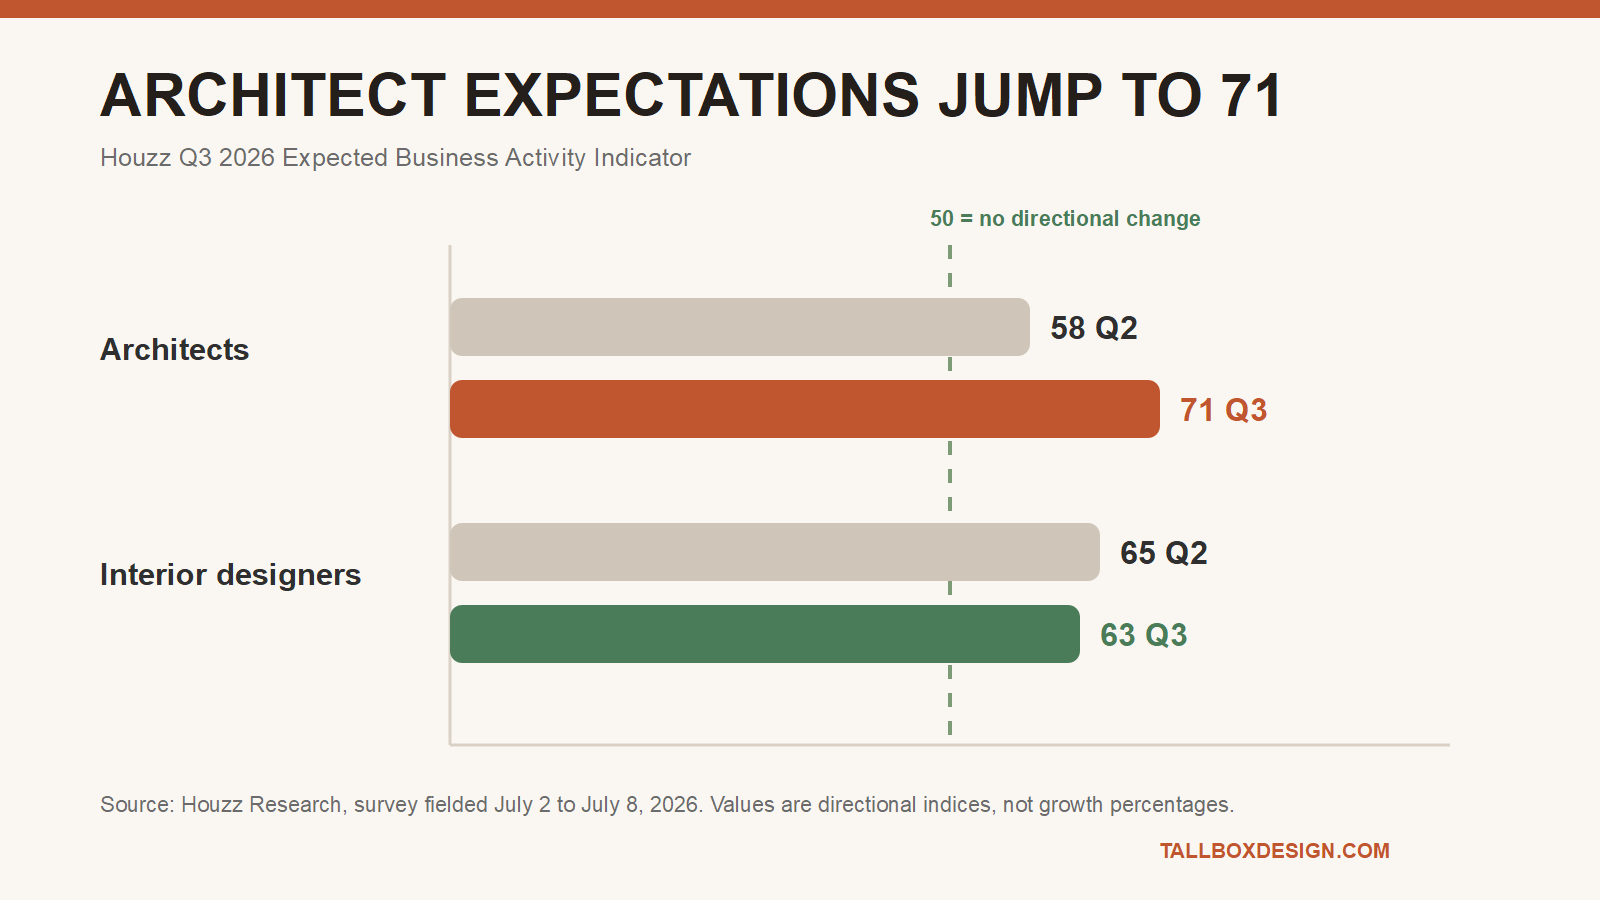
Houzz’s Q3 2026 architect expectation score of 71 is a diffusion index, not a predicted growth rate. Above 50 means more surveyed firms expect inquiries and committed projects to increase over the next three months than decrease.
Houzz recorded architect expectations for project inquiries at 71 and new committed projects at 72, both up from 58 in Q2 2026. An inquiry begins a conversation, while a committed project has crossed a commercial decision point.
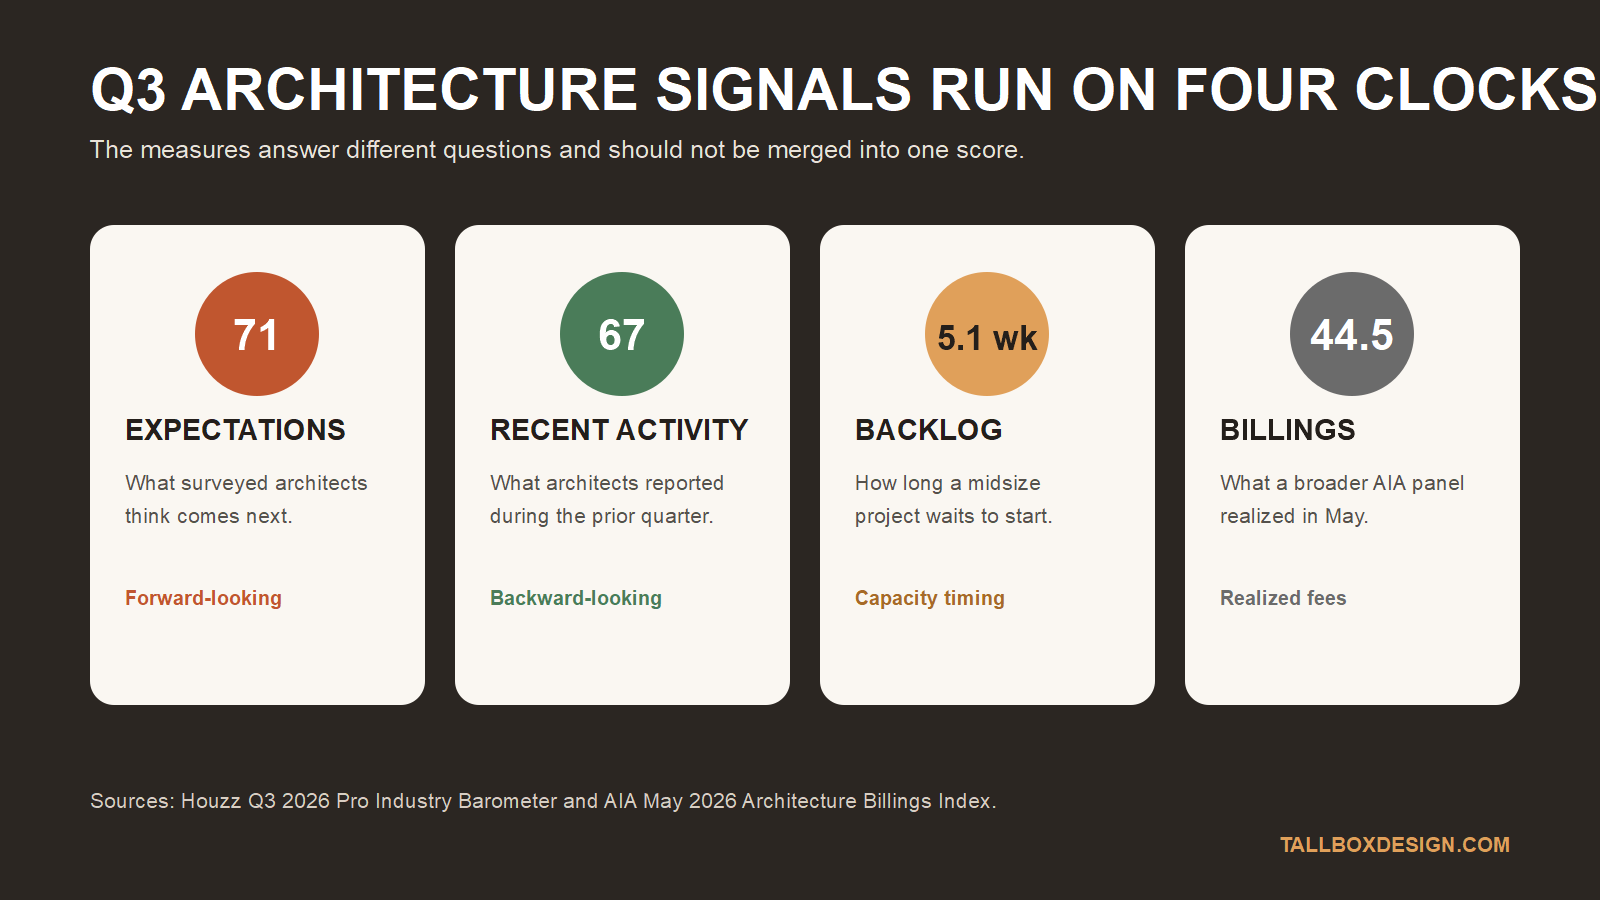
Houzz’s Q2 2026 recent-activity index also improved. Architects reported 67, up from 45 in Q1 2026, with inquiries at 68 and new committed projects at 66. Expectations therefore sit four points above the measured rebound.
The Houzz July 2026 sample sets the boundary of the claim. It surveyed businesses with Houzz profiles, so the result describes that residential design market rather than every U.S. practice, public-sector commission, commercial studio, or institutional program.
Why can architect confidence rise while project backlogs shrink?
Architect confidence and project backlog measure different stages of demand. The expectation index looks ahead three months, while backlog records the current wait before a midsize project can begin.
Houzz found that architects’ reported wait time fell from 6.7 weeks in Q3 2025 to 5.1 weeks in Q3 2026. A shorter wait can mean available capacity, faster starts, smaller jobs, or a thinner stock of already-secured work. The survey does not choose among those causes.
The reduction from 6.7 to 5.1 weeks equals almost one quarter of the previous wait. For a client, the shorter wait may mean an earlier start. For a practice owner, it is a reason to inspect signed scope, fee value, and team loading before calling the pipeline full.
Why did the AIA billings index fall below 50 as architect confidence rose?
The AIA/Deltek Architecture Billings Index recorded 44.5 in May 2026, its lowest level since January 2026. Below 50 means more panel firms reported falling billings than rising billings during the month.
AIA’s May 2026 billings report also gave rounded Q3 expectations: 25% foresaw a fall of at least 5%, 46% expected little change, and 30% expected a rise of at least 5%.
Houzz and AIA do not cancel each other out. Houzz focuses on residential renovation and design businesses with Houzz profiles, while AIA’s broader panel tracks architecture billings and serves as a lead indicator for nonresidential construction. Different samples and project stages can move in opposite directions.
Fee realization normally trails the first inquiry because proposals, appointments, design phases, approvals, and invoicing sit between interest and revenue. Optimism can improve before billings, but the timing gap must close for the rebound to support payroll and outside production capacity.
Which project-pipeline gates justify adding capacity?
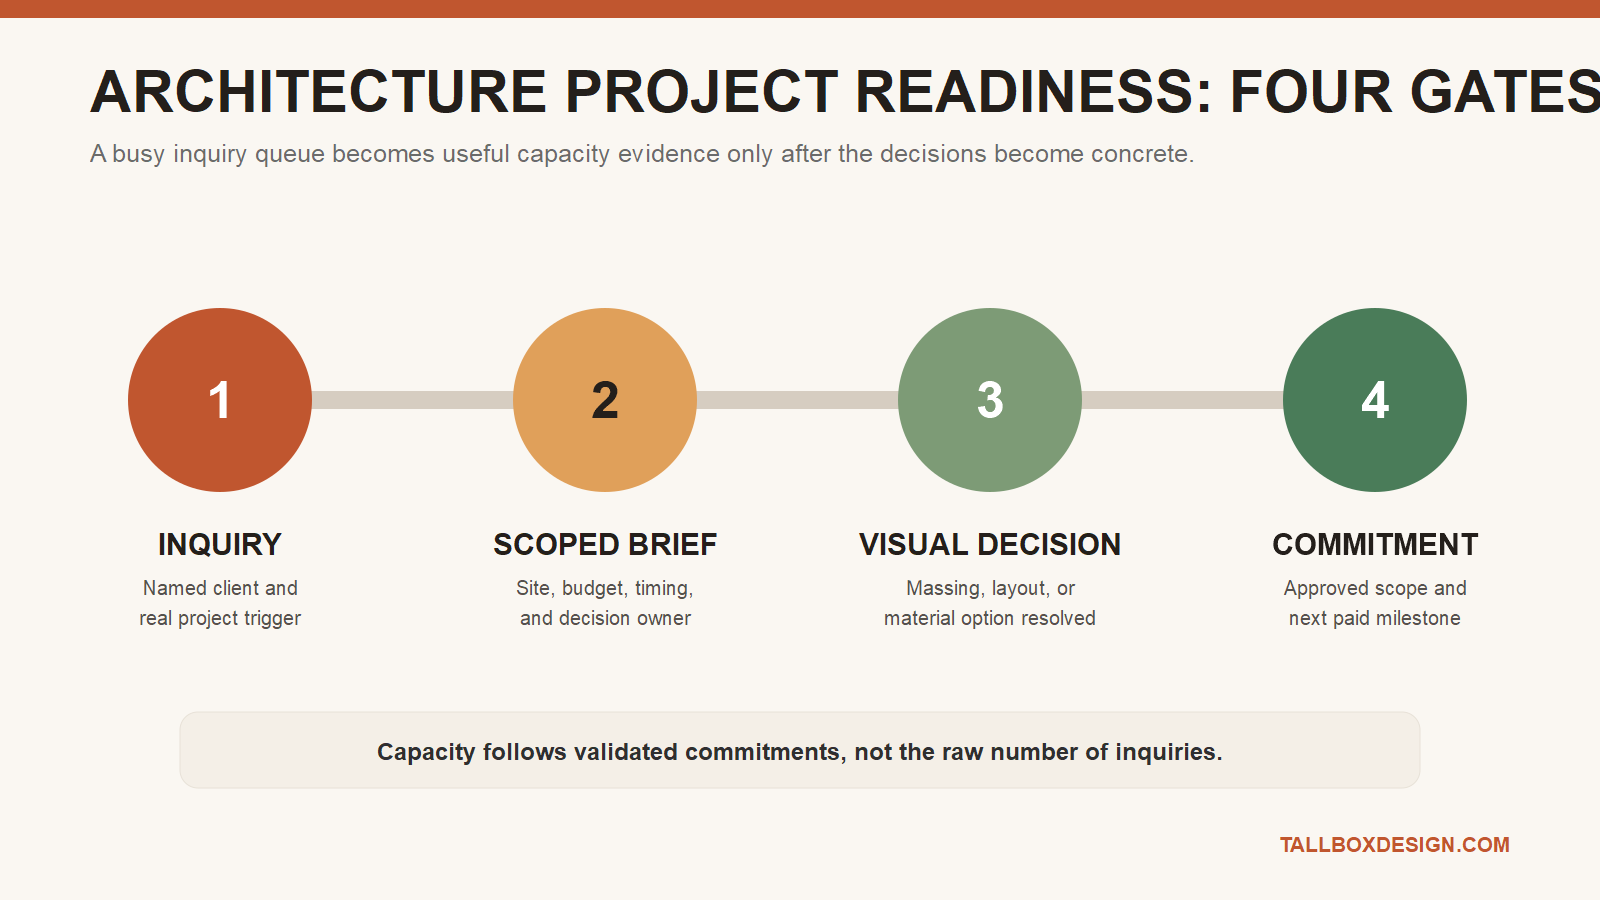
Architecture firms need four gates before treating stronger sentiment as staffing evidence. Each gate converts a broad signal into a more specific commitment without pretending that an inquiry already equals earned work.
The Tallbox four-gate sequence is stricter than a sales funnel. It asks whether the project has a real site and owner, whether constraints are documented, whether stakeholders can decide among concrete options, and whether the next stage has an approved commercial basis.
How does architectural visualization test project readiness?
Early architectural visualization turns an abstract preference into a reviewable object. A camera-matched exterior, massing study, or material option lets clients and consultants approve, reject, or revise a specific proposition before later documentation carries the ambiguity forward.
In this project-readiness test, a polished render is not enough. The useful signal is whether the visual produces a decision on height, facade rhythm, window placement, daylight, or material direction. Tallbox’s architectural CGI process functions as a decision checkpoint when the image has that defined job.
A polished image without a named decision can hide indecision because every participant can admire it without accepting a consequence. A useful visual checkpoint records the option shown, the question asked, the people approving it, and the change that follows.

This decision-evidence distinction appears in recent project coverage. The Seoul Daechi redevelopment renderings communicate program and scale, while the stacked-flats feasibility checks test site fit. Different visuals serve different decisions.
What should architecture firms verify before adding Q3 capacity?
Architecture firms should compare the four clocks inside their own pipeline before adding permanent capacity. Count qualified inquiries separately from scoped briefs, approved visual decisions, contracted projects, and invoiced work.
A firm with rising inquiries, short backlog, and weak billings has a conversion or timing question. A firm with committed projects, lengthening start dates, and stable collections has a capacity question. Those conditions require different responses even when both firms report optimism.
A weekly review can track inquiries, qualified briefs, and visual approvals, while monthly accounts track contracted value, invoices, and cash collection. Keeping the cadences separate prevents a lively week of conversations from being mistaken for a durable quarter of work.
How should firms interpret the Q3 architecture outlook?
Houzz’s score of 71 shows rising architect confidence, and the recent-activity score of 67 shows that optimism followed the Q2 2026 activity rebound. The shorter 5.1-week backlog and AIA’s 44.5 billings index temper the outlook.
Q3 architecture demand looks more promising than settled. By separating inquiries, briefs, visual decisions, commitments, and billings, firms can test whether the rebound is reaching their project pipeline.
Sources and citations
- Houzz Research. Q3 2026 U.S. Houzz Pro Industry Barometer: Architectural and Design Services. Published July 2026. Accessed July 20, 2026.
- American Institute of Architects. ABI May 2026: Architecture firm billings weaken further. Published June 2026. Accessed July 20, 2026.