As Realtor.com expands its Market Clock to 100 U.S. metros this quarter, buyers and sellers in most large American cities hold a buyer-favorable position the data series has not recorded since before the pandemic. The national clock reads 3 o’clock, balanced and loosening toward buyers. That headline hides how differently the 100 metros behave.
Realtor.com Economic Research published the reading on July 21, 2026. Analyst Jake Krimmel reports 70% of the top 100 metros now favor buyers or trend that way, up from 52% a year earlier and 37% in 2019. Buyer’s markets hold 19% of the map, their largest second-quarter share since 2019, against 25% in seller territory.
A Market Clock quadrant measures leverage posture, the supply-and-demand tilt between buyers and sellers. It is not a sale price, an affordability level, or a forecast.
The national 3 o’clock masks that the 100 metros sit across 9 of the 12 clock positions, so your price, your offer, and your listing evidence should match your metro’s hour, not the national read.
What does the Market Clock measure, and why is it not a price forecast?
Realtor.com’s 100-metro Market Clock reports a national 3 o’clock reading that only means something once that boundary is stated. The clock maps each metro to one of twelve positions, where noon-side readings favor sellers and six-o’clock-side readings favor buyers.
A quadrant is a composite of supply-and-demand signals (the months-supply-style pace at which inventory meets demand), not a transaction result. Two metros can share an hour yet post different prices. A “buyer’s market” therefore describes leverage, not a guaranteed discount on any single home.
Three o’clock sits on the seller-to-buyer boundary, leaning just enough toward buyers that the national read sounds softer than most local hours are. It is a posture rather than a price level. Reading it as a sign that the market is fine everywhere is exactly the mistake the metro map is meant to correct.
One national clock, one hundred different hours
In the Q2 2026 Market Clock, Chicago, Detroit, Minneapolis, Cleveland, and Cincinnati were among the metros moving out of seller territory, while Cape Coral and North Port sat deep in buyer territory. Twelve metros changed quadrant since the first-quarter report, eight of them graduating from seller to loosening status.
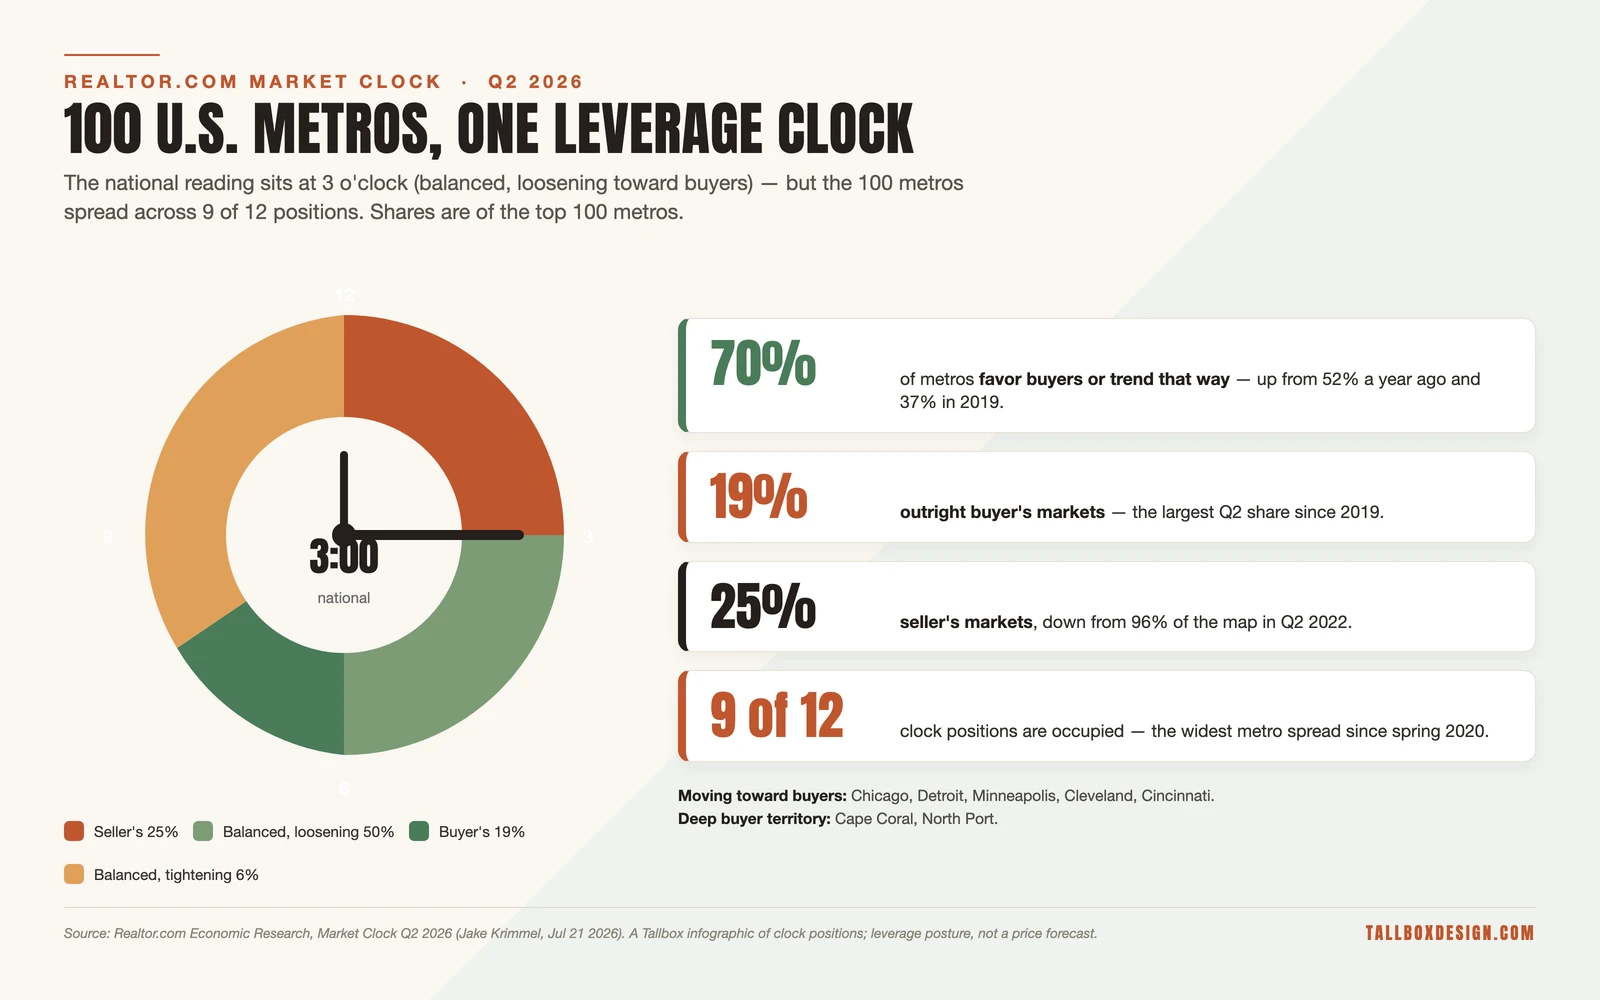
The 100 metros span nine of the twelve positions, the widest spread since spring 2020. Florida’s deepest buyer’s markets, Cape Coral and North Port among them, have begun walking back from the trough, moving from 5 toward 7 on the face. A national average cannot carry that geographic spread.
Thirteen more metros moved two full hours toward buyers without changing quadrant, among them Bakersfield, Lakeland, Miami, Orlando, Palm Bay, Port St. Lucie, San Antonio, and Syracuse. They slid deeper into buyer territory rather than crossing a line. Movement this spring has been almost entirely one-directional.
The thaw concentrated in the Midwest and Northeast. Florida and the Gulf coast, by contrast, held the country’s deepest buyer’s markets, which is why so many of the names on the mover list sit in the Sun Belt.
In buyer-leaning metros, sellers finally cut their asking prices
Realtor.com’s Q2 Market Clock data show list prices per square foot falling year over year in 60 of the 100 clock metros. That is up from 46 metros in 2025 and zero in June 2022, and it tracks the quadrant rather than scattering at random.

Sellers are pricing right at the list instead of correcting later, which is why price-cut shares fell even as asking prices did. Roughly three-quarters of buyer’s markets display that full falling-prices, falling-cuts combination, against about half of loosening markets and one in six seller’s markets.
These are asking-price figures, not closed-sale prices, and asking prices can fall while the closed-sale record tells a different story. The boundary matters when a quadrant tilts toward buyers.
Seller’s markets held 96% of the map in the second quarter of 2022, against 25% today. That swing is why Realtor.com calls this the most buyer-friendly spring in the clock’s history, a series that runs back to 2018. The tilt is broad, but it is not uniform across regions.
How does a local clock hour change what a list price and a photo set must prove?
Reading the 100-metro Market Clock this way turns the national 3 o’clock into a local checklist for pricing and presentation. Where the clock favors buyers, a list price has to be defended by recent comps and honest condition, because shoppers compare harder and discount for anything they cannot see.
The listing’s photo set carries more weight in the same hour. Buyers comparison-shop across dozens of homes, so photos that prove condition, usable space, and working systems earn their keep. In a seller-leaning hour the same price and photos face far less scrutiny.
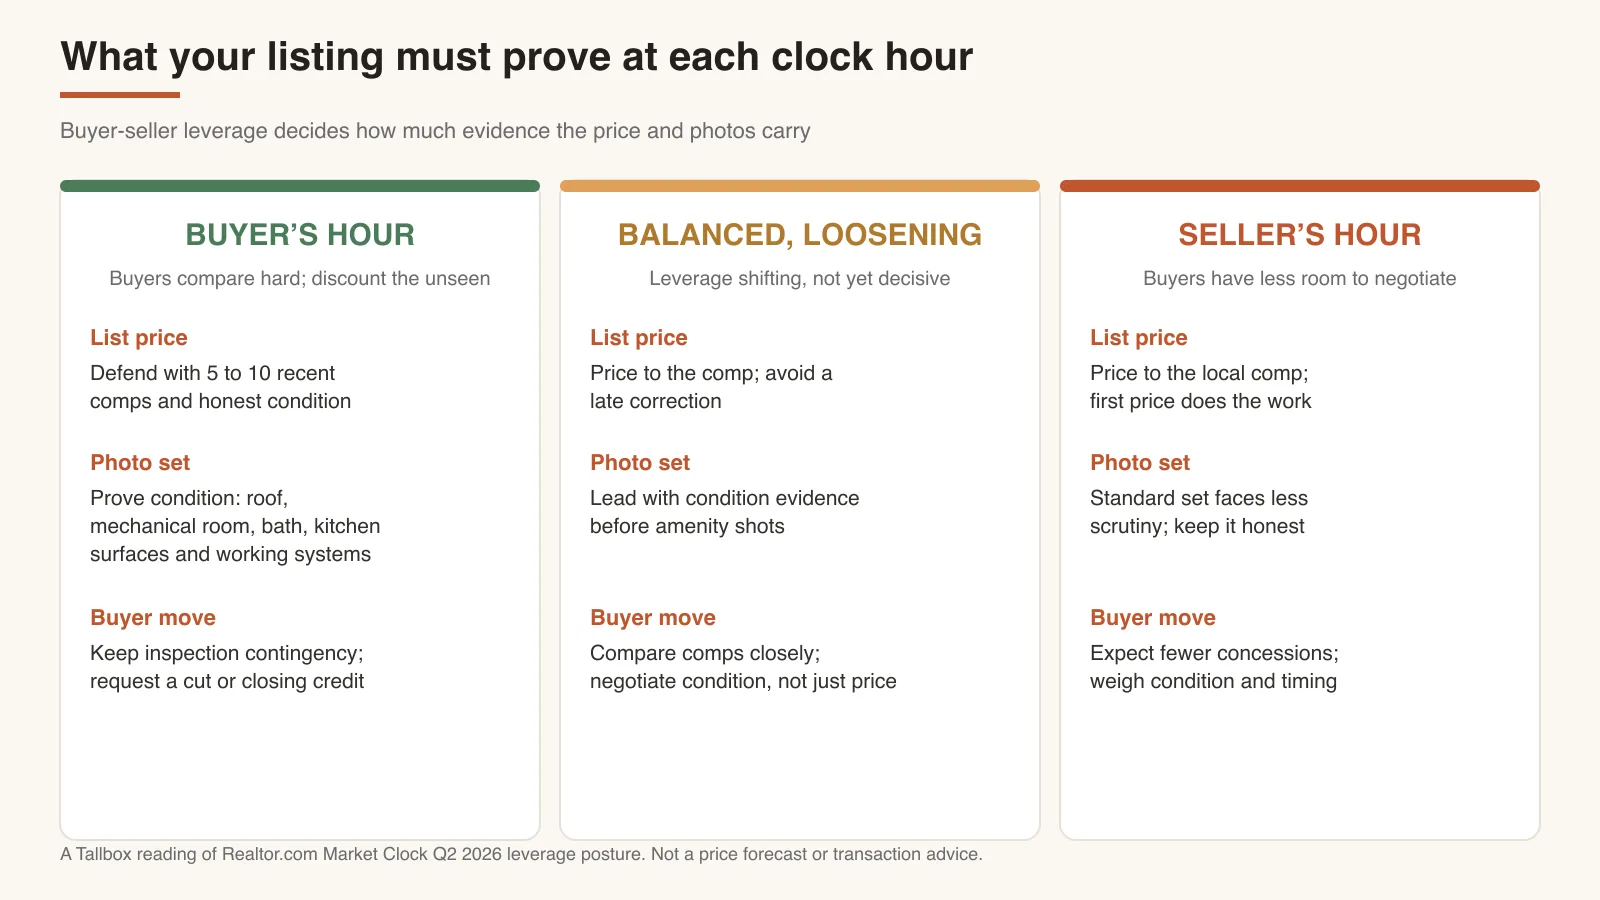
A buyer-hour listing survives by removing doubt. Photos of the roof, the mechanical room, the primary bath, and the kitchen surfaces let a shopper tick condition boxes without a return visit. The hour tells you how much of that proof the price has to carry before an offer arrives.
For sellers, a buyer-leaning hour means the first list price carries most of the load. A home that lists above its comps and waits for a cut signals stale inventory to shoppers who have other options. Pricing to the evidence up front is what keeps days-on-market from climbing.
That is the same leverage logic behind learning to sell a home in a buyer’s market: match the price and the evidence to the local hour, not to the national headline.
Match your move to your metro’s hour
Against the Market Clock’s buyer-heavy Q2 map, most readers will find their own metro tilting toward buyer leverage. The move is to look up your city’s position on the Realtor.com Market Clock tool, then align your tactics to that quadrant.
- Buyer’s-hour metros. Keep an inspection contingency, request a price reduction or a closing credit, and compare five to ten recent comps before you bid.
- Balanced but loosening. Lead with condition evidence and price to the comp, because leverage is shifting but not yet decisive.
- Seller’s-hour metros. Price to the local comp and front-load condition photos, since buyers have less room to negotiate.
Realtor.com publishes the Market Clock as a public tool, and the Q2 report lists quadrant shifts metro by metro. A two-minute check of your own city beats trusting the national number. The quadrant is the input; your comps, your contingencies, and your photos are the decisions.
None of this is a forecast or a buy-or-sell verdict. The clock tells you which way leverage leans right now, and your evidence should follow that lean rather than the national 3 o’clock. The hour that justifies an inspection contingency in one metro may not justify one an hour down the highway.