Why DOM (Days on Market) is needed?
DOM tracks market efficiency and property desirability. It helps sellers price effectively, gives buyers negotiation insights, enables market trend analysis, and signals potential property issues. DOM indicates whether homes sell quickly or stagnate, revealing supply-demand balance in specific markets.

George is a seasoned interior designer and property marketing strategist with over 13 years of experience. He specializes in transforming properties into visually stunning spaces, helping clients recognize the potential and beauty in each property. With an impressive international client base of exciting projects throughout Europe and America.
How Does DOM work?
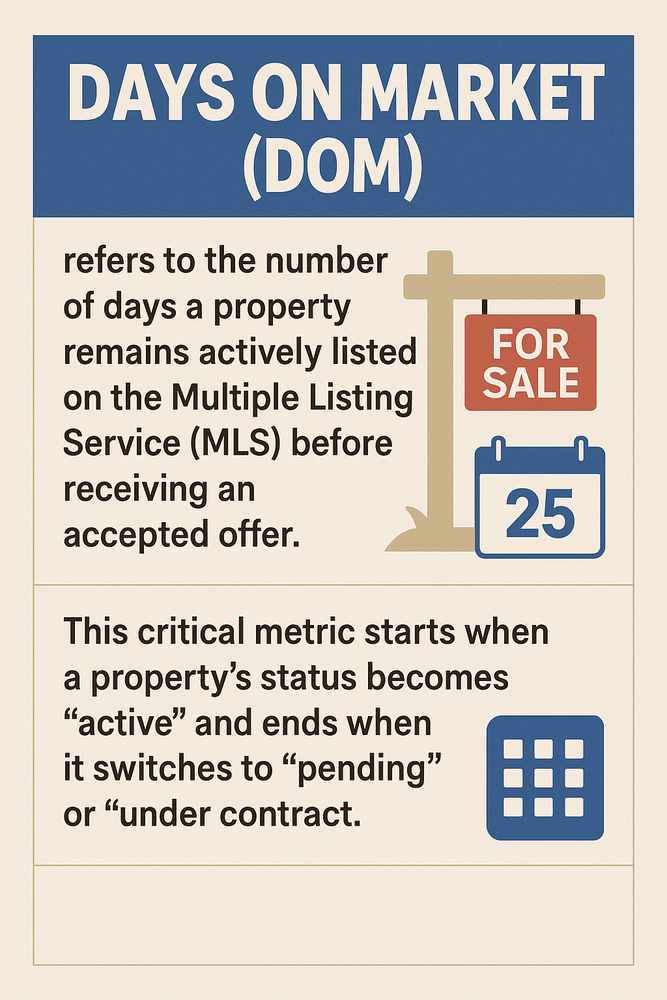
Days on Market (DOM) refers to the number of days a property remains actively listed on the Multiple Listing Service (MLS) before receiving an accepted offer. This critical metric starts when a property’s status becomes “active” and ends when it switches to “pending” or “under contract.”
DOM serves as a crucial market health indicator. Low average DOM (under 30 days) typically signals a seller’s market with high demand and competitive buying, while high DOM (over 60 days) may indicate a buyer’s market, overpricing, or property issues. The national average hovers around 30 days but varies significantly by location, property type, and price point.

For sellers, DOM directly impacts pricing strategy and negotiation power. Properties with extended DOM often require price reductions (typically 5-10% after 90+ days) to generate interest. For buyers, high DOM creates leverage for below-asking offers or additional concessions like repair credits or closing cost assistance.
Importantly, DOM can be manipulated through agent tactics like delisting and relisting to reset the counter, creating a misleading appearance of freshness. Sophisticated buyers look beyond DOM to DOMP (Days on Market-Property), which tracks a property’s cumulative market time regardless of listing changes.
The metric helps all parties gauge market conditions, set realistic expectations, and develop appropriate strategies for pricing, offers, and negotiations in their specific market context.
Average Days on Market
How Average Days on Market does work?
Below is an example of how Average Days on Market works.
Average Days on Market (DOM) serves as a crucial barometer for real estate market health, showing significant variation across regions and time periods. As of February 2025, the national average stands at 66 days—5 days longer than last year but still 11 days faster than pre-pandemic norms.
Regional differences are pronounced: Midwest properties now spend 8 more days on market compared to 2024, Southern homes 7 more days, Western properties 4 more days, and Northeastern listings 2 more days. These variations reflect divergent market conditions, with Portland, Oregon experiencing the most dramatic slowdown (+21 days year-over-year).
Several key factors influence DOM:
-
Pricing strategy is paramount—overpriced listings consistently languish longer. Properties priced within 2-3% of automated valuation models typically sell 20-30% faster.
-
Market conditions like inventory levels and mortgage rates directly impact DOM. The 24.6% year-over-year national inventory increase (29.9% in the South) has tempered sales velocity.
-
Seasonal patterns persist despite market shifts, with winter traditionally showing slower activity. The first quarter of 2025 saw 6% fewer new listings in markets like West Michigan.
-
Property characteristics matter—updated homes sell 15-25% faster than those needing work.
-
Local economic factors create micro-market variations. Strong job markets (Colorado Springs, Miami) often maintain faster sales despite broader slowdowns.
For strategic market participants, these DOM trends signal a gradual shift toward equilibrium after years of seller dominance, particularly in Sun Belt regions with accelerated construction.
What the Average Days on Market indicates?
Average Days on Market indicates market temperature, revealing buyer/seller advantages. Low numbers signal seller’s markets with limited inventory and competitive bidding. High numbers indicate buyer’s markets with excess inventory and negotiation opportunities. This metric varies by location, price range, and season, reflecting economic conditions.