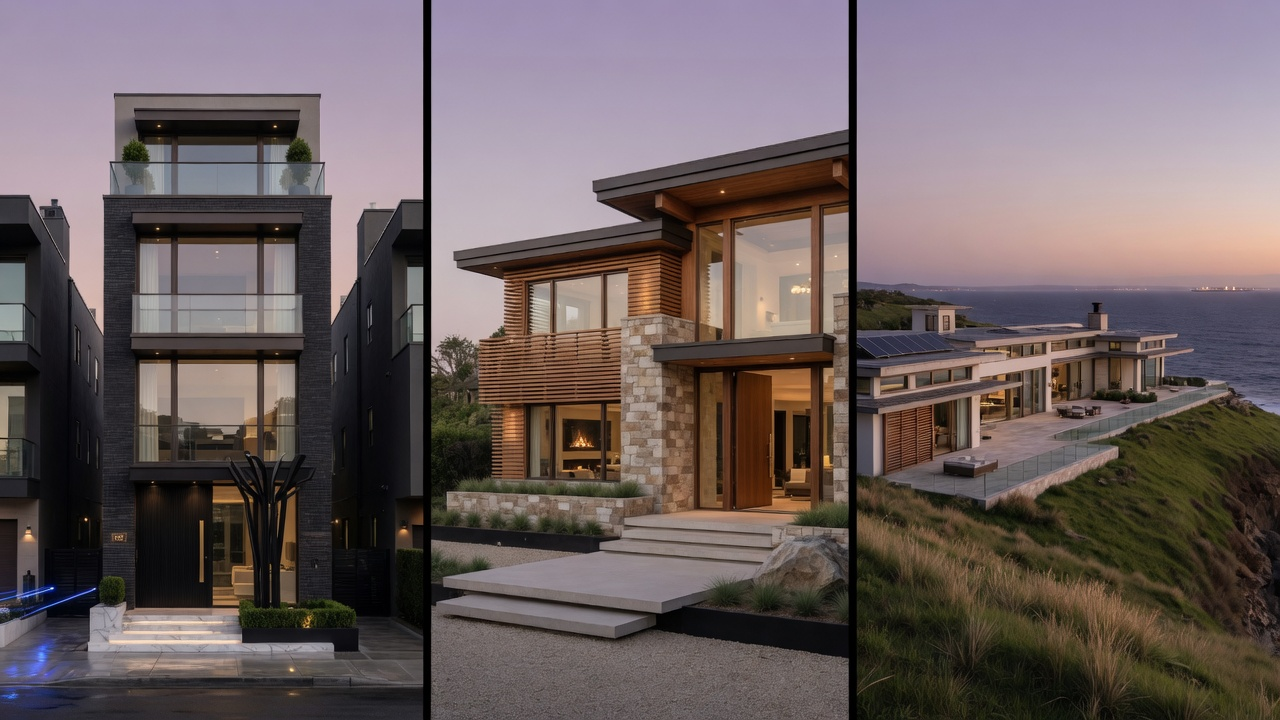
The luxury housing market in the United States now operates at three listing-price tiers, and each tier needs different visual proof. Choosing what the images must prove starts with the tier. In the national entry point to luxury was $1,277,907, high-end luxury began just under $2 million, and ultraluxury started at $5.51 million.
The three luxury tiers come from Realtor.com’s June 2026 Luxury Housing Report, which ranks active listings by market-specific price percentiles. The 90th percentile marks entry-level luxury, the 95th marks high-end luxury, and the 99th marks ultraluxury. The figures are listing prices, not completed sale prices, so they describe what sellers ask rather than what buyers paid.
Realtor.com does not label these tiers as three separate markets; that reading is Tallbox’s editorial interpretation.
Our studio’s position is that each tier carries its own proof burden. This guide maps each luxury tier to the facts its frames must prove, so sellers and listing agents decide which evidence to commission before photography, staging, or CGI begins.
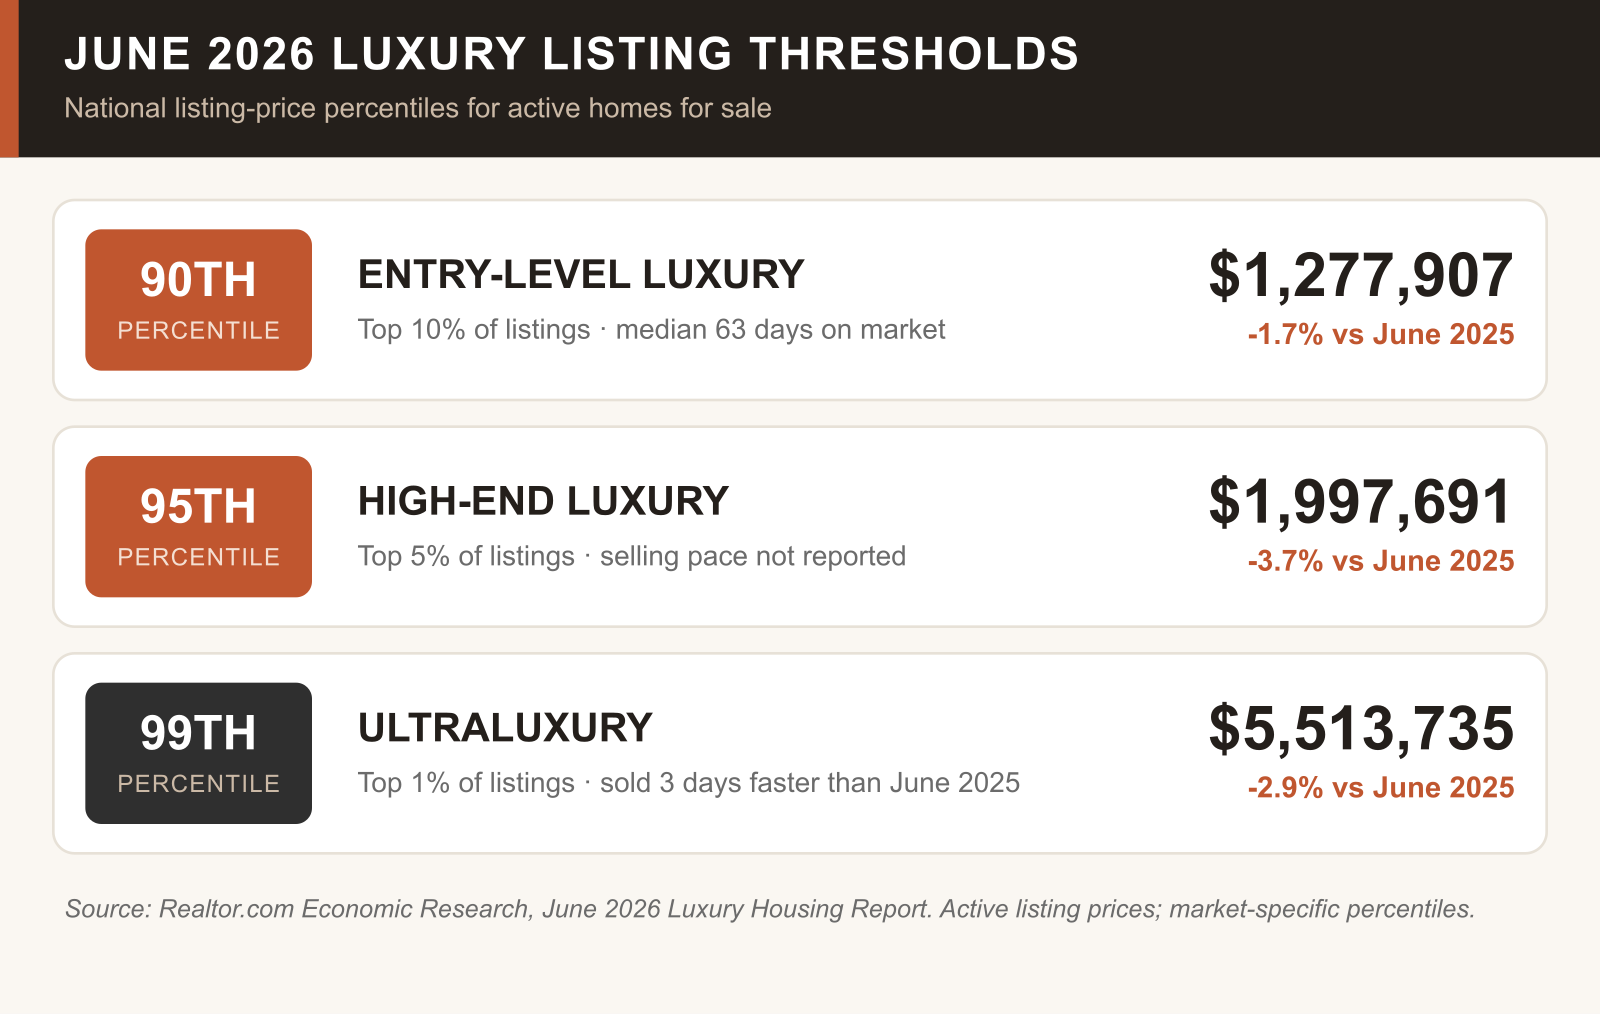
All three national luxury listing thresholds fell year over year. The 90th percentile fell 1.7 percent, the 95th fell 3.7 percent, and the 99th fell 2.9 percent. marked the 27th straight month of annual declines at the entry threshold.
Luxury selling pace held even as asking thresholds softened. The top 10 percent of listings sold in a median of 63 days, two days faster than a year earlier, and the top 1 percent moved three days faster.
A different definition flips the apparent trend. Redfin’s May 2026 report defines luxury as the top 5 percent of each metro’s price range and tracks completed sales rather than asking prices.
Over the three months ending , Redfin put the median luxury sale price at $1,388,230, up 3.6 percent year over year. Realtor.com’s June listing thresholds moved the other way, falling at all three percentiles. The two series measure different quantities, so their numbers should not be merged into one story about luxury prices.
Match the visual brief to the percentile
The visual brief changes with the percentile because a buyer weighing $1.3 million is not asking the same question as a buyer weighing $5.5 million. The first asks whether the premium buys real quality; the second asks whether the property is genuinely rare. The image sequence has to answer the question each tier poses.
The technical baseline does not change across tiers. Full-resolution frames, honest color, straight verticals, and consistent exposure are the minimum requirement at every price. What changes is which facts the frames must prove.
The wider relationship between high-end property and the way it is presented runs through our guide to the luxury real estate connection. Presentation is part of the asset’s evidence, not decoration around it.
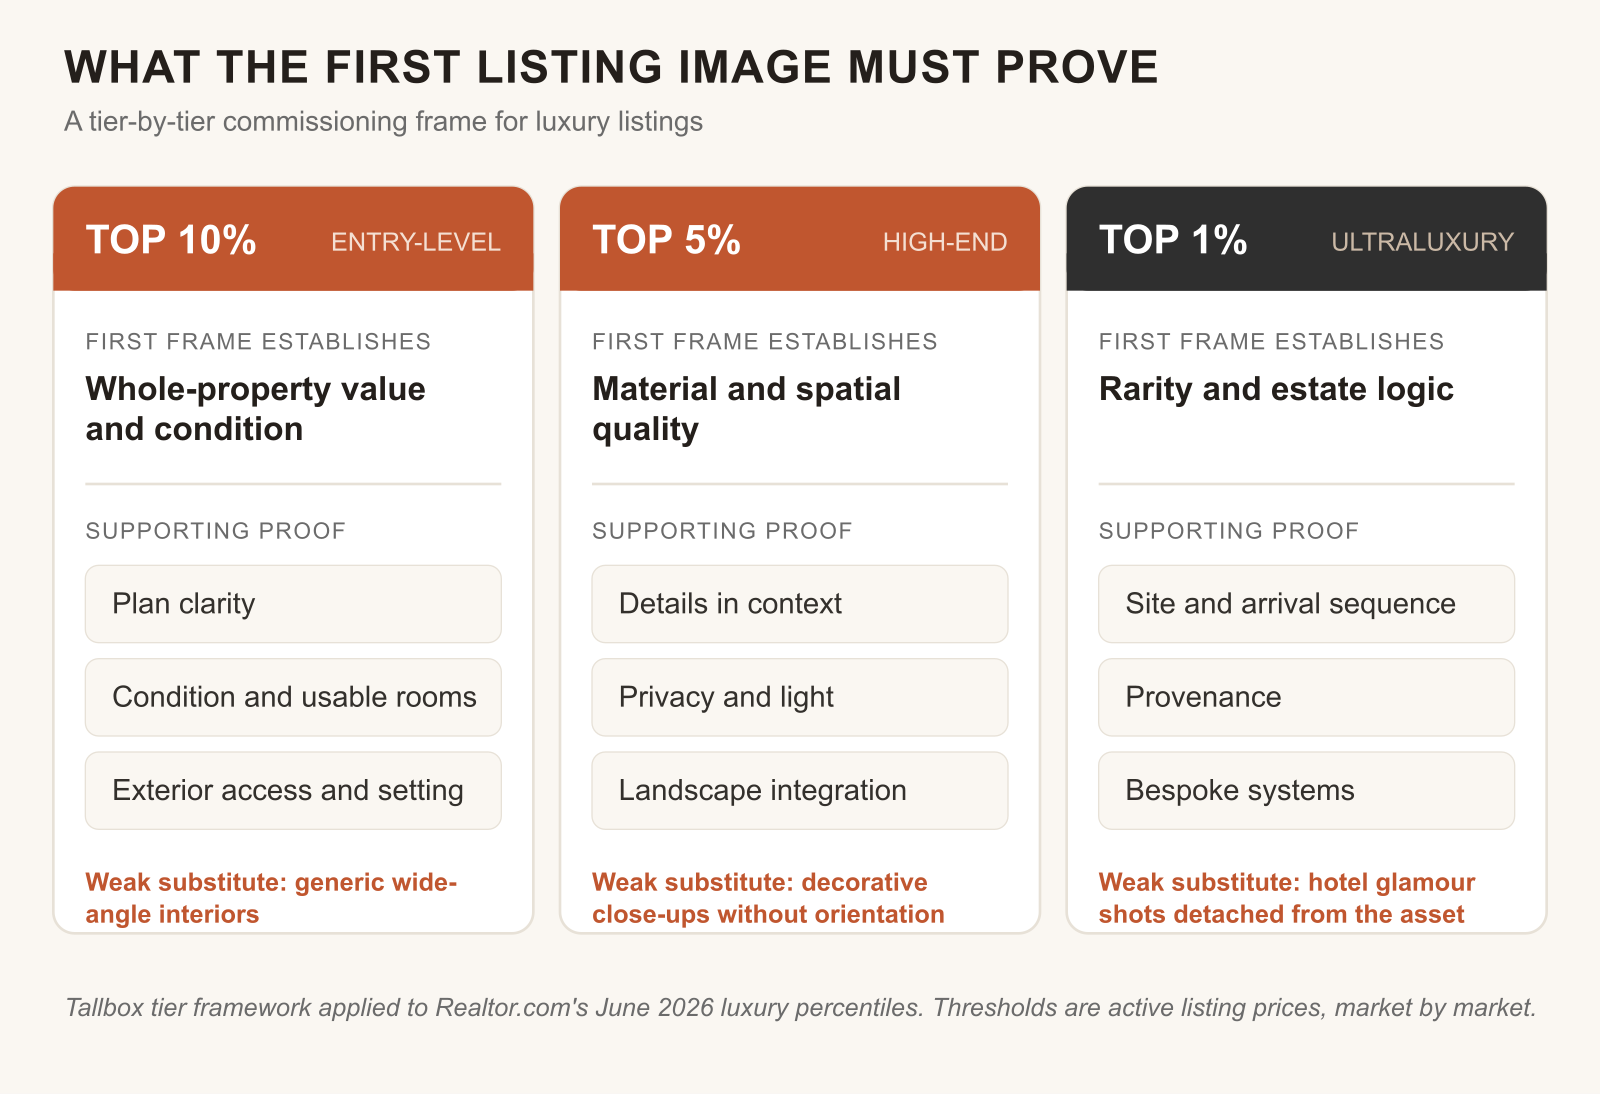
Buyer risk drives the brief. At the 90th percentile the buyer fears overpaying for an ordinary home with cosmetic finishes, so condition and plan clarity carry the sequence. At the 99th percentile the fear is missing something irreplaceable, so frames must document what money cannot easily recreate. Land position, provenance, and arrival are the proof.
Lead with the site in vacation markets
Destination markets decouple price from floor area. In Nantucket, the June 90th-percentile threshold reached $14,117,250, according to the same Realtor.com report. The median listing priced between $1 million and $2 million offered just 1,011 square feet.
A buyer paying Nantucket prices is purchasing site, water access, outlook, and scarcity before square footage. The first frame for such a property may need to establish the bluff, the dock, or the historic street before any interior appears.
Mountain destinations reverse the emphasis on different grounds. View corridors, slope position, and trail access can outweigh interior sequence. The pattern is not a national rule, but the local definition of rarity still decides what frame one must prove.
For sellers in vacation and destination luxury markets, the photography commissioning order reverses from which room leads to which site fact leads. A view corridor, a deeded dock, or a protected dune can be the attribute the first frame must establish.
Commission evidence per luxury tier, not adjectives
Commissioning starts from the question each frame must answer, not from a reusable luxury shot list. Where the tier cards above named each proof burden, this table turns the burden into a commissioning brief and adds the weak substitute that fails the tier.
Source: Tallbox analysis built on Realtor.com’s June 2026 luxury listing percentiles. Thresholds are active listing prices, calculated market by market.
Frame order matters as much as frame content in a luxury image sequence. Our piece on telling a story through photos of luxury property listings covers sequencing for luxury real estate listing images in detail, from the establishing shot to the final detail.
Check the image package before launch
The image package needs a five-point check from the agent and seller before a luxury listing goes live.
- ✓Identify the local percentile. Ask for the market-specific 90th, 95th, and 99th thresholds, because national figures only set the national frame.
- ✓Name the defensible premium attributes. Materials, site features, provenance, and custom work that survive scrutiny belong in frames; adjectives do not.
- ✓Match every claim to a frame. Each premium attribute named in the copy needs a photograph or visualization that proves it.
- ✓Remove repeated views. Duplicate angles of the same room spend frames that could prove a different attribute.
- ✓Test the first five images. Without reading any copy, a stranger should be able to state what the property is and why it commands its price.
Photography is not the only evidence tool available for this check. Where a key view, addition, or unbuilt element cannot be photographed yet, architectural CGI can produce the missing frame from plans and site data, provided the visual conforms to the documented design.
The takeaway
Visual ambiguity costs more at the 99th percentile than at the 90th. A $1.28 million listing loses buyers to unanswered condition questions; a $5.5 million estate loses them to undocumented rarity.
Define the evidence each frame must carry before photography, staging, or CGI begins. The shot list follows the proof burden, never the other way around.