Homeowners install solar systems costing $15,000–$25,000 to generate decades of electricity savings. The 30% federal credit reduces upfront investment to $10,500–$17,500, and owned systems boost home values 6.9% through measurable energy production. For example, a homeowner spending $18,000 on a solar system might see their upfront cost reduced to $12,600 after the federal credit. Over 20 years, they could save $40,000 on electricity bills and improve their property’s resale value.

George is a seasoned interior designer and property marketing strategist with over 13 years of experience. He specializes in transforming properties into visually stunning spaces, helping clients recognize the potential and beauty in each property. With an impressive international client base of exciting projects throughout Europe and America.
Why Solar Makes Sense in the US?
Solar adoption accelerates as equipment costs drop 40% since 2010, enabling homeowners to compete with utility rates across 42 states. Declining installation prices and stable federal incentives through 2032 create optimal conditions for residential investment.
It’s crucial to act quickly; after 2032, the 30% federal tax credit will taper, resulting in potentially higher upfront costs and longer payback periods. Without this credit, payback times may extend beyond the current 6-10 year span, highlighting the urgency for timely solar adoption.
Homeowners achieve payback within 6-10 years through utility bill reduction, then gain 15-20 years of free electricity worth $25,000–$50,000. Utility-scale solar generates power at $16-$35/MWh), driving down equipment costs and making home installations more competitive.

Who Should Consider Solar?
Homeowners maximize returns when they own south-facing roofs, use $1,200 or more in electricity annually, and plan to stay in their homes for 7 or more years to capture investment benefits. Meeting all these conditions is not necessary, but they help optimize financial returns. Readers should assess which factors apply to their circumstances to determine eligibility.
Solar works best when you:
- Own and maintain structurally sound roofing less than 15 years old.
- Eliminate roof shading from trees or structures between 9 AM and 3 PM.
- Pay high electricity rates exceeding $0.12/kWh monthly.
- Desire energy independence and protection from utility rate escalation
- Qualify for stacked incentives beyond federal tax credits.
Avoid solar if you need roof replacement within 5 years, struggle with significant shading, or operate in markets with extremely low rates below $0.08/kWh.
Solar Panel Cost Breakdown by Region
Upfront Investment vs. Long-Term Returns
System costs are distributed across equipment (40%), installation labor (20%), permitting processes (10%), electrical components (20%), and contractor margins (10%).
Solar panels | $0.50–$1.20/watt | Monocrystalline panels deliver higher efficiency, justify premium pricing |
Inverters | $0.30–$0.70/watt | String inverters reduce costs; microinverters optimize individual panel performance |
Installation services | $0.40–$0.80/watt | Complex roof configurations increase labor requirements and costs |
Permits & inspections | $200–$2,000 total | Municipal fees vary dramatically, affecting total project costs |
Electrical infrastructure | $0.20–$0.40/watt | Includes monitoring systems, safety disconnects, production metering |

ROI calculation: Homeowners invest $20,000 to generate $1,200–$2,000 in annual savings, reaching break-even in 7-10 years before capturing 15+ years of profit. Framing this in household terms, these savings translate to a ‘utility pay raise’ of approximately $100–$165 per month. This monthly reduction mirrors typical budgeting strategies, making the benefits of solar energy feel both tangible and manageable.
Regional Cost Analysis
Installation costs fluctuate $0.50–$1.50 per watt between states as labor markets, permitting streamlining, and incentive structures create pricing advantages in competitive markets. Lined permitting and established installer networks deliver lower per-watt pricing despite equivalent equipment costs.
Federal and State Solar Incentives Explained
The federal Residential Clean Energy Credit provides a 30% tax reduction for complete solar installations through 2032, cutting average system costs by $4,500–$7,500. State and local programs add $2,000–$10,000 in cash rebates and performance incentives.
To find local programs, homeowners should visit their state’s energy office or utility company’s website, which often lists current solar incentives. Resources like the Database of State Incentives for Renewables & Efficiency (DSIRE) offer detailed, state-specific information on available incentives.
The Federal Solar Tax Credit (ITC)
The Investment Tax Credit covers 30% of total installation costs, including equipment, labor, and permits for systems activated 2022–2032. Credit percentages decline to 26% in 2033 and 22% in 2034 before expiring.
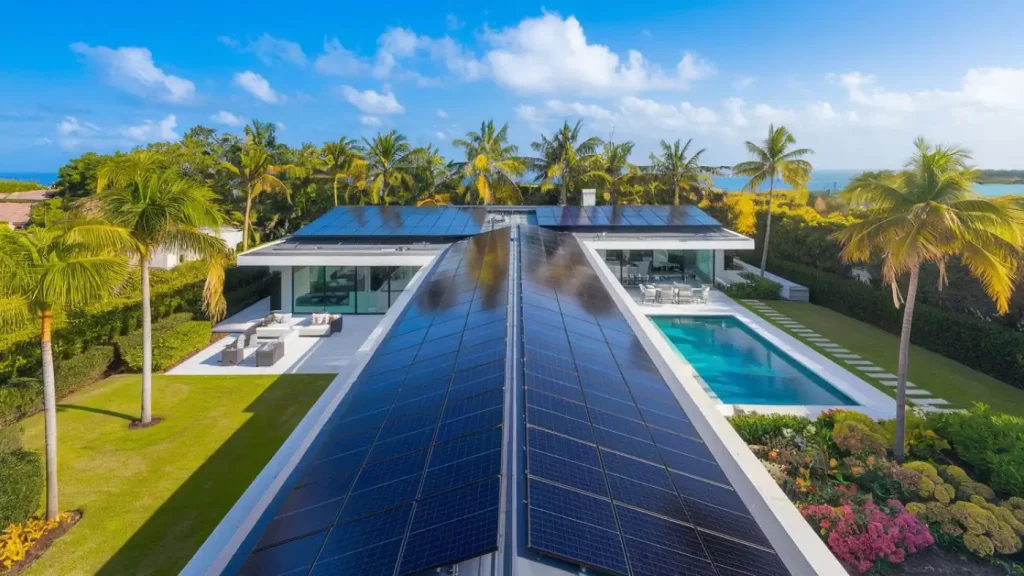
- Complete cost coverage, including all installation components and permits
- Unlimited credit amounts for residential installations without caps
- Credit carryover to future tax years when the current liability is insufficient
- Battery storage inclusion when installed alongside solar panels
- Professional tax consultation recommended to maximize credit utilization
Premium State & Local Rebate Programs
California SGIP | Battery storage rebates | $200–$400/kWh | Focuses on energy storage system capacity |
New York NY-Sun | Installation rebates | $0.30–$0.70/watt | Declining block structure varies by utility territory |
Massachusetts SMART | Performance payments | $0.05–$0.15/kWh | 20-year production-based compensation |
New Jersey SREC | Renewable credits | $50–$200/MWh | Tradeable certificates based on energy production |
Connecticut RSIP | Installation incentives | $0.35–$0.48/watt | Direct rebates through utility programs |
Contact local utilities to discover additional rebates. Many utilities provide $500–$2,000 cash incentives for verified solar installations.
How Solar Systems Enhance Home Resale Value?
Homes with owned solar systems command 6.9% higher sale prices than comparable properties, adding $15,000–$20,000 in market premiums. Owned systems boost value while leased systems typically contribute no resale benefit.
Sample $110 Plan:
- $40 on a set of 6-8 quality solar spotlights Use string lights to illuminate a path or feature tree, creating a warm and inviting atmosphere for your fall gatherings.
- $30 on a curated selection of winter-hardy plug plants Consider planting asters (heathers, grasses, pansies) for containers to brighten your fall landscape.
- $30 on a durable garden tool like a sharp edging spade or a compost aerator that will last for years.
Community Sourcing: Explore tool libraries for borrowing items you only need once, like a shredder. Connect with local arborists for free woodchips and neighbours for plant divisions.
Appraiser and Buyer Evaluation Criteria
Property appraisers value solar installations using cost approaches ($4 per watt) or income methods ($20 value per $1 annual savings). Owned systems generate measurable value increases, while leased systems create no appraisal benefit and complicate transactions.
Elements that maximize resale premiums:
- Complete system ownership through cash purchase or loan financing
- Substantial warranty coverage with 20+ years remaining
- Verified performance data demonstrating actual energy production
- Professional installation quality with minimal roof penetrations
- Appropriately sized systems matching home energy consumption patterns
Value-reducing factors:
- Lease obligations transferring monthly payments to new owners
- Outdated technology from pre-2015 installations with lower efficiency
- Installation defects or visible system damage requiring repairs
- Oversized systems generate excess power without storage or compensation.
Investment Recovery Timelines
Most homeowners recover their solar investments within 6-10 years through utility bill savings, then enjoy 15-20 years of free electricity, worth $25,000–$50,000 in cumulative savings.
Recovery accelerates in regions that implement time-of-use pricing, where solar production offsets expensive peak-demand electricity.
Premium electricity markets (>$0.18/kWh) | 4-6 years | $40,000–$60,000 total savings |
Average rate markets ($0.12–$0.18/kWh) | 6-8 years | $25,000–$40,000 accumulated value |
Low-cost markets (<$0.12/kWh) | 8-12 years | $15,000–$25,000 long-term benefit |
Avoiding Costly Solar Installation Mistakes
Critical installation errors can lead to additional costs ranging from $5,000 to $15,000. Strategic planning helps in avoiding these pitfalls. Homeowners should focus on three key themes:
How to Assemble a Bug Hotel (5 Modules)?
- Frame: Use a simple box frame made from reclaimed wood or stacked bricks.
- Logs & Wood: Drill holes of varying diameters (2-10mm) into logs and blocks of wood for solitary bees.
- Canes & Stems: Pack hollow stems like bamboo canes, teasel heads, and raspberry canes tightly into a section for lacewings.
- Tiles & Stones: Create cool, damp crevices for frogs and newts by stacking broken terracotta tiles or stones.
- Siting your plants properly can enhance the cozy feel of your small backyard landscaping ideas. Place the hotel in a sheltered spot with some sun and some shade, ideally near nectar-rich plants.
Installer:
Verify contractor qualifications by choosing NABCEP-certified professionals with local licenses, comprehensive insurance, and over five years of documented experience.
- Avoid single-quote decisions by obtaining three to five detailed competitive bids that compare pricing structures, equipment specifications, and warranty coverage.
- Roof: Ensure roof conditions by replacing aging roofing before installation to avoid costly system removal and reinstallation.
- Size the system to offset 90-100% of annual consumption rather than peak monthly usage.
- Financing: Prefer purchasing over leasing systems to maximize financial returns and capture home value appreciation.
- Thoroughly review all warranty details, maintenance obligations, and performance guarantees with legal counsel.
- Avoid rushing timelines by planning installations during optimal weather conditions and when utility interconnection is available.
Pre-installation verification checklist:
- Confirm installer credentials through independent reference verification.
- Secure detailed written specifications with equipment model numbers
- Complete structural roof assessment, identifying necessary repairs
- Review all contractual obligations with qualified legal representation.
- Understand utility interconnection procedures and expected timelines.
- Establish system monitoring protocols and maintenance scheduling.
Frequently Asked Questions
How do homeowners maintain solar panel performance?
Solar panels require minimal ongoing maintenance; homeowners perform quarterly visual inspections while scheduling annual professional cleanings, which cost $150-$ 300. Modern monitoring systems alert owners to performance issues requiring attention.
Homeowners maintain systems through:
- Quarterly visual inspections checking for debris, damage, or shading changes
- Continuous performance monitoring via smartphone applications, tracking daily production
- Annual professional cleaning in areas with significant dust or pollen accumulation
- Proactive tree trimming prevents new shade patterns from reducing output.
- Scheduled inverter replacement every 10-15 years, costing $2,000-4,000
How do solar systems operate during power outages?
Standard grid-connected systems automatically shut down during outages to protect utility workers. Homeowners install battery backup systems or specialized inverters to maintain power during grid failures.
Outage response options:
- Grid-tied systems: Shut down completely during utility outages for safety
- Battery backup integration: Powers essential loads for hours or days, depending on capacity
- Whole-home backup: Requires substantial battery investment ($15,000+) for complete coverage
- Generator coordination: Combines solar production with backup generator systems
What financing options optimize solar investments?
Homeowners maximize returns by purchasing systems with cash or solar loans while avoiding lease agreements that eliminate tax benefits and home value increases.
Financing comparison:
- Cash purchases: Eliminate interest costs, maximize tax credits, provide the highest long-term returns
- Solar loans: Enable installation with monthly payments while preserving ownership benefits
- Home equity financing: Offers low interest rates using property as collateral
- Lease agreements: Reduce upfront costs but eliminate tax credits and resale value benefits
- Power purchase agreements: Lock in electricity rates but transfer no ownership benefits
Homeowners should calculate the total cost of ownership including interest, tax benefits, and resale value impact when selecting financing methods. To help with this, use online solar cost calculators on renewable energy websites. These tools estimate potential savings and financial benefits over time. Some calculators allow input of local electricity rates and installation costs for personalized results. It is also wise to consult a financial advisor for a tailored analysis based on individual circumstances.
Homeowners can conduct a quick self-audit to guide their payment path.
- Do you itemize taxes?
- Is home-equity interest deductible for you?
Reflecting on these questions can help in making confident and informed financial decisions.