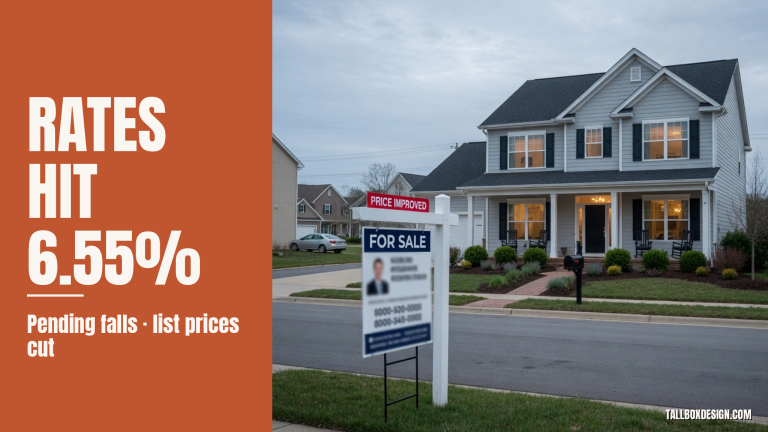
Quick answer: Sale prices record completed deals, while asking prices record active seller positions before negotiation. Buyers need local comparable sales, competition, and payment math; sellers need local closings, competing listings, and price-cut patterns. A national median supplies direction, not a property valuation.
Redfin reported a record median U.S. sale price of $408,776 in June 2026, up 2.2% from a year earlier. Realtor.com reported a median asking price of $430,000 in the same month, down 2.5% year over year, the steepest annual decline in its data since 2017.
The $408,776 sale-price median and $430,000 asking-price median do not describe the same homes at the same market stage. Redfin counted completed sales, while Realtor.com measured active listings. Local comparable sales matter most when pricing a home; national medians supply market context.
Housing price measures at different transaction stages
The median sale price is recorded from completed transactions, whereas the median asking price records active listings before negotiation. Redfin reported a $408,776 U.S. closed-sale median for June 2026.
A median asking price records the middle advertised price among active listings. Realtor.com reported a $430,000 June median, down 2.5% year over year, across existing single-family homes and attached housing listed on its platform.
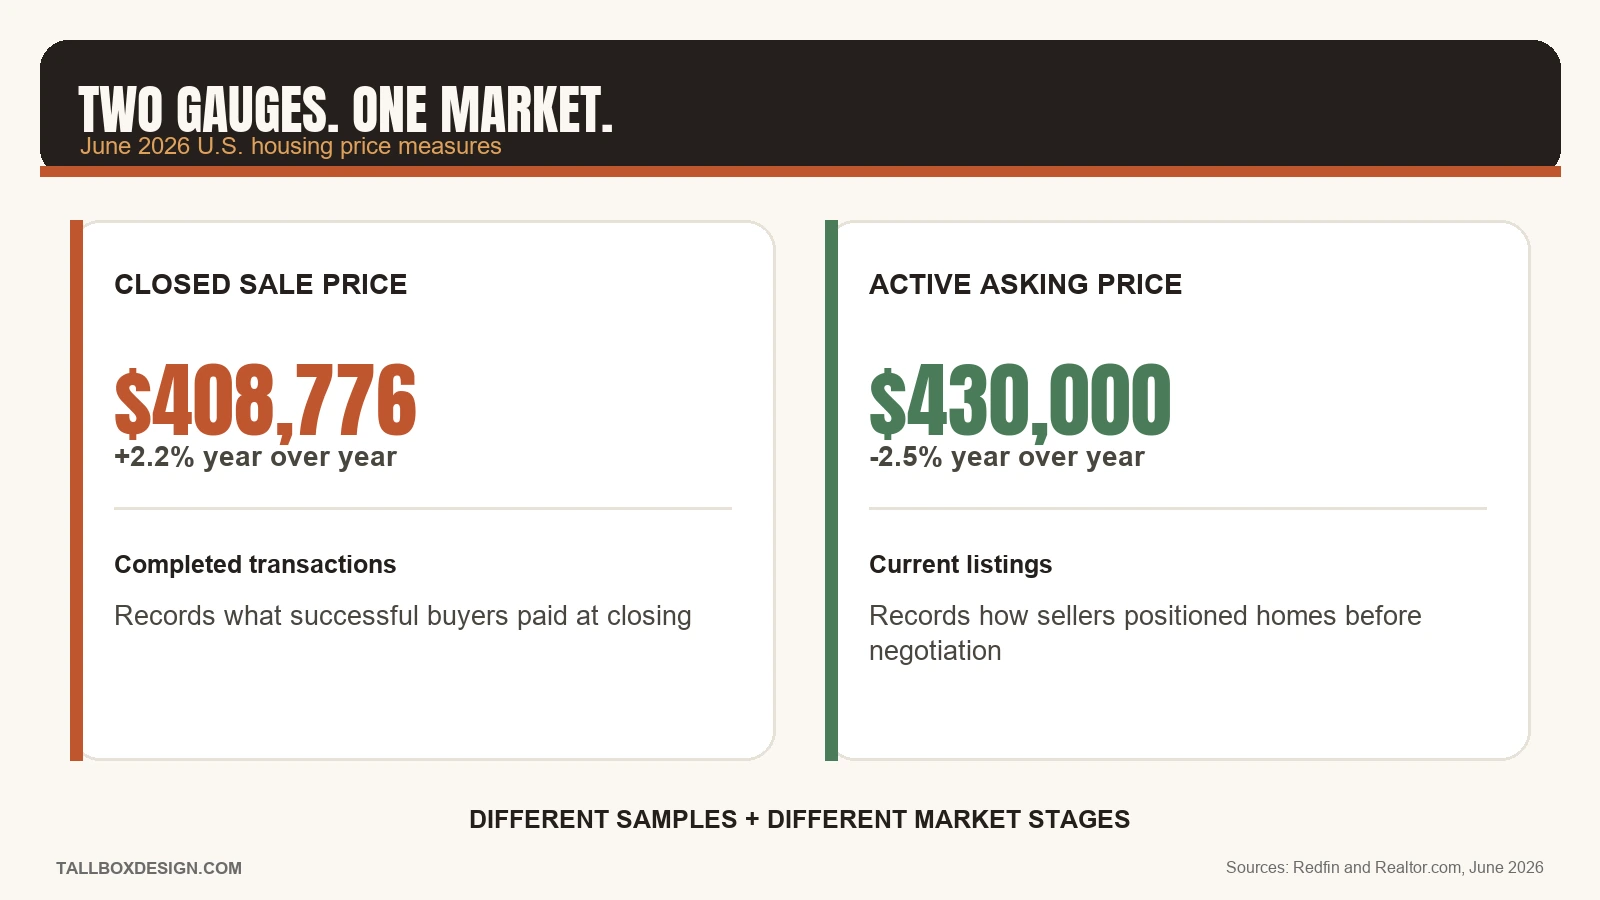
The comparison separates the samples before either median informs a property decision.
| Housing price measure | Homes in the sample | Market moment | Use |
|---|---|---|---|
| Median sale price | Completed sales | Closing | What buyers paid at closing |
| Median asking price | Active listings | Before negotiation | How current sellers are positioning homes |
The two medians do not track identical properties. Home size, price tier, geography, and the share of listings that close can change the middle observation.
The $21,224 difference is not a national discount. Closed-sale data shows completed-market direction; active-listing data shows seller positioning.
Five housing-price metrics for five decisions
A five-metric housing-price dashboard assigns one question to each measure. National medians frame market direction, while property-specific evidence narrows an offer or list price.
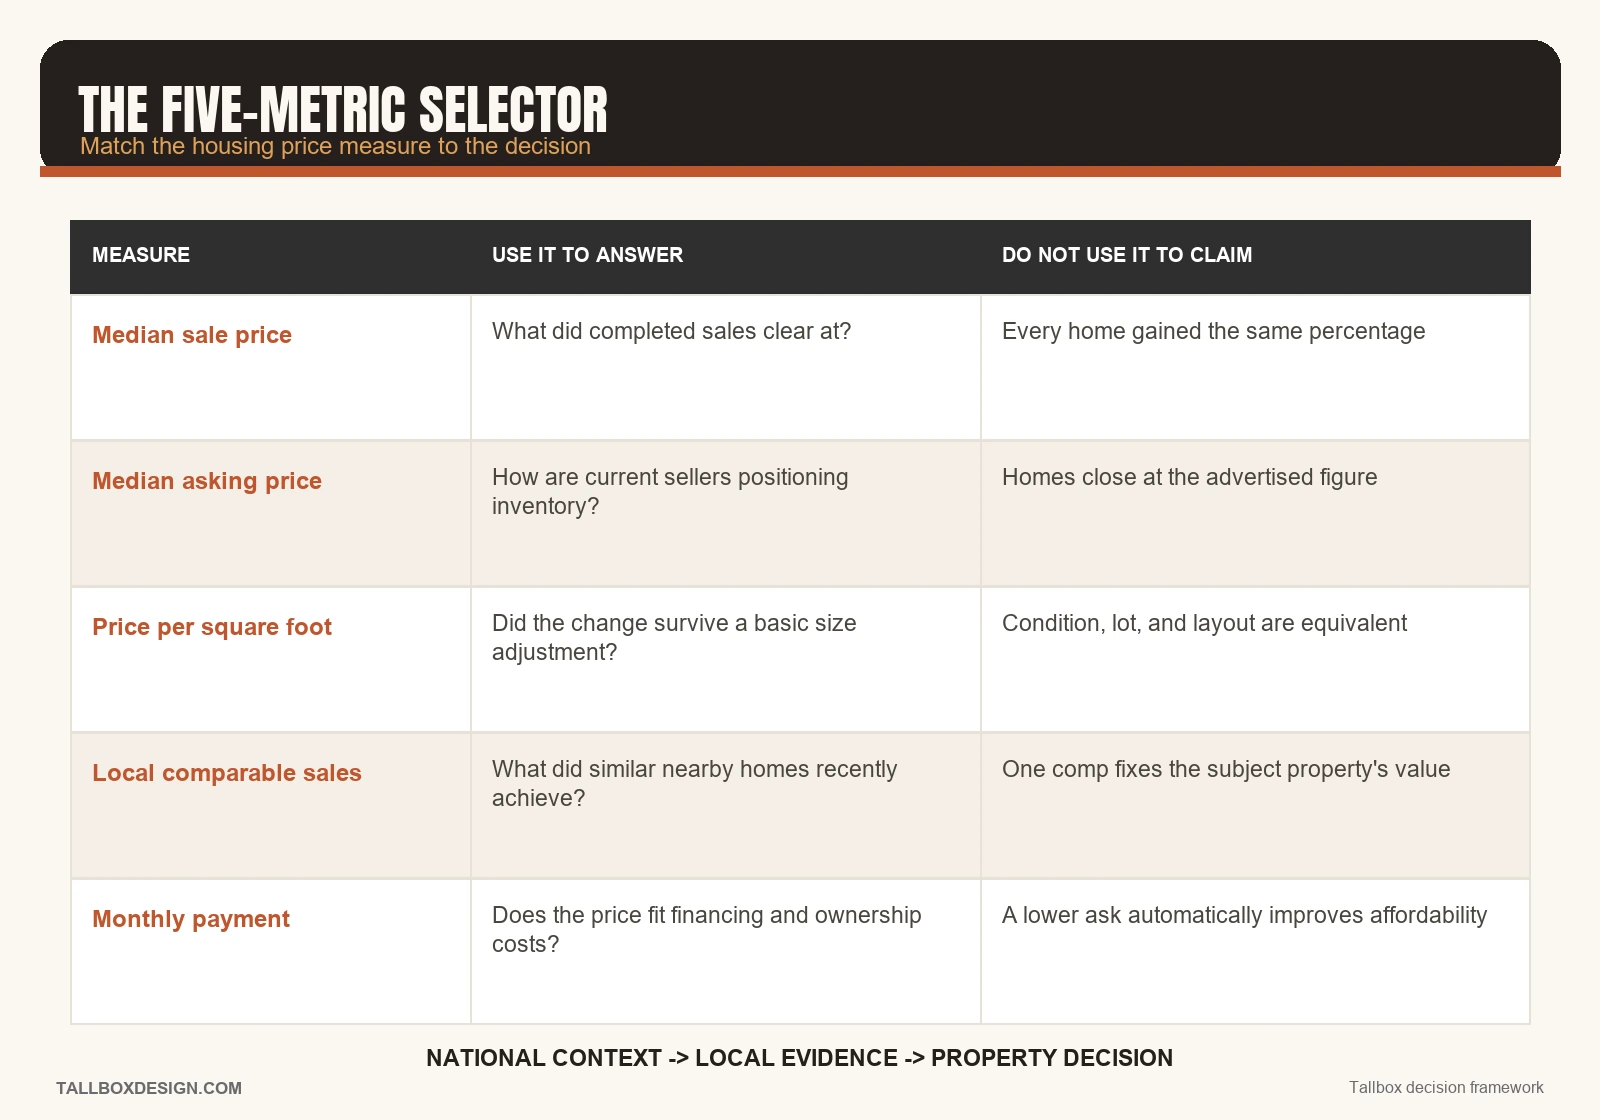
The table matches each measure to a supported decision.
| Housing-price measure | Decision the measure supports | Claim the measure cannot support |
|---|---|---|
| Median sale price | What did the completed market clear at? | Every home gained the same percentage |
| Median asking price | How are current sellers positioning inventory? | Homes close at the advertised figure |
| Price per square foot | Did a price change persist after adjusting for home size? | Two homes with different condition and lots are equivalent |
| Local comparable sales | What did similar nearby homes recently achieve? | A single comp fixes the subject property’s value |
| Monthly payment | Does the price fit the buyer’s financing and ownership costs? | A lower asking price automatically improves affordability |
Realtor.com recorded a 2.1% annual decline to $228 per square foot in June 2026. The per-square-foot decline supports broader asking-price softness but does not isolate changes in listing mix.
Freddie Mac’s FRED series averaged 6.49% for a 30-year fixed mortgage in June 2026. Principal-and-interest costs can remain high after an asking-price cut.
The five measures move from national direction to local property evidence and a buyer’s payment limit. Sample mix explains why national medians and local comparable sales can diverge.
Geographic sales mix inside the national median
A national median reflects the locations and homes that reached closing, not matched appreciation for every property. In June 2026, Redfin recorded sale-price gains of 9.2% in San Francisco and 8.6% in West Palm Beach.
Redfin reported June 2026 closed sales up 23.1% year over year in San Francisco and 23.8% in West Palm Beach. Those volume increases added transactions from two high-priced metros, but the report does not quantify their effect on the U.S. median.
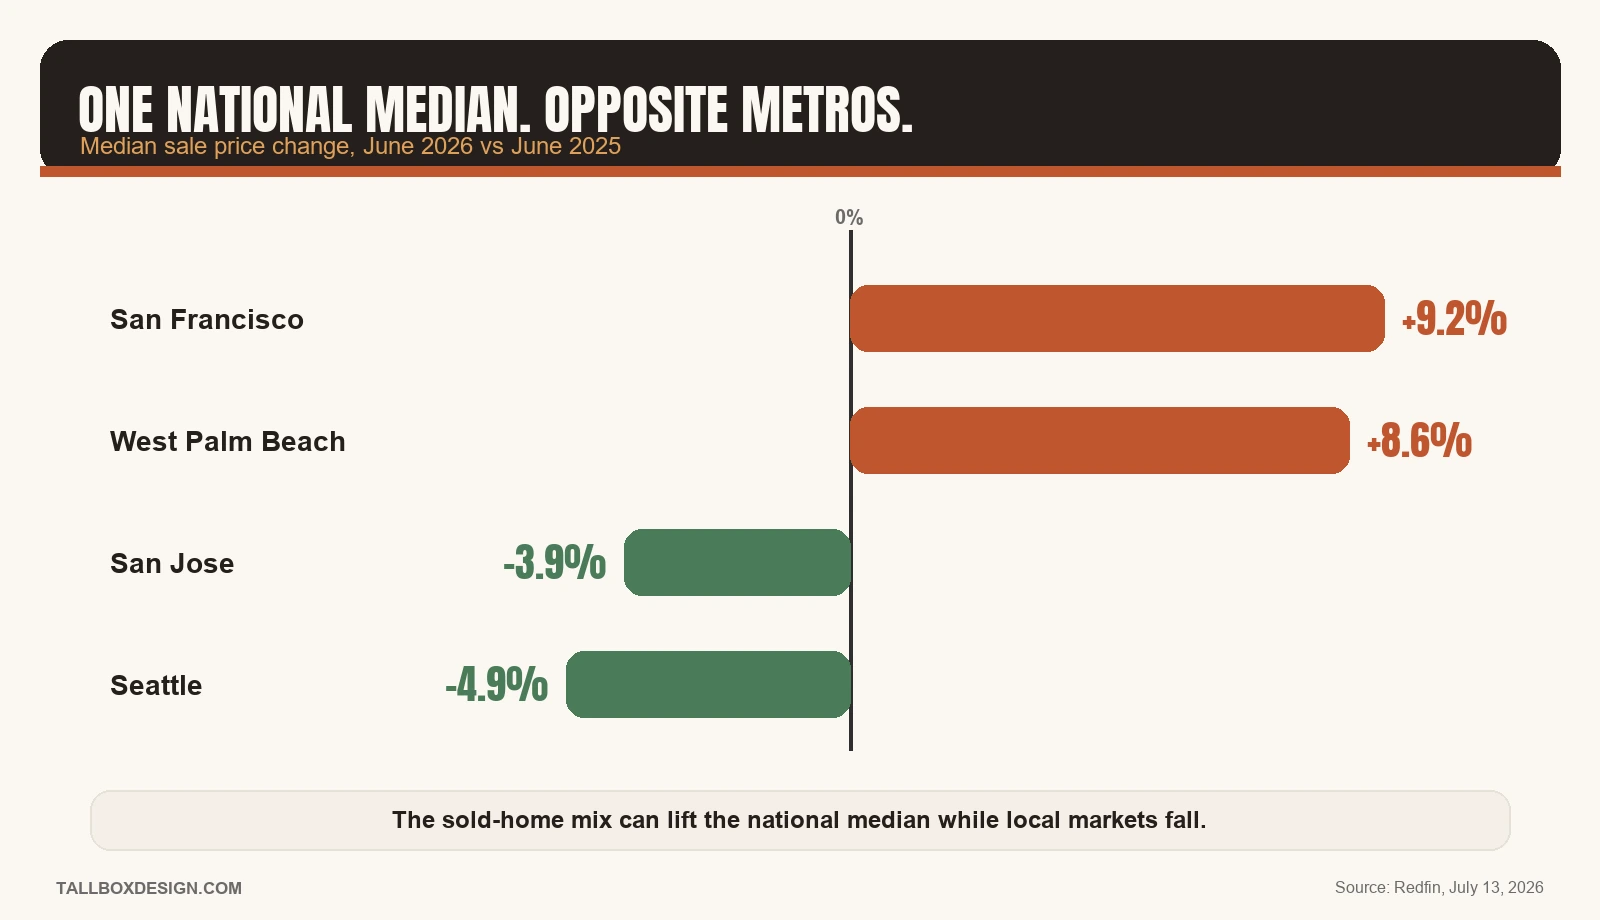
The four-metro comparison shows why a national record cannot replace a local negotiating benchmark.
Redfin reported annual sale-price declines of 4.9% in Seattle and 3.9% in San Jose in June 2026. Realtor.com’s June 2026 active-listing data showed regional divergence. Median asking prices fell 4.0% in the West, 2.5% in the South, and 1.0% in the Northeast; the Midwest was flat.
San Francisco’s increase does not set a benchmark for a Seattle home because the metros moved in opposite directions. The national record did not mean uniform local appreciation.
Geographic and property mix prevent a national median from pricing a specific home. Local comparable sales remain the first offer input.
Which housing price matters before a buyer’s offer?
Recent comparable sales establish an offer range, active listings show competition, and payment math sets the buyer’s limit.
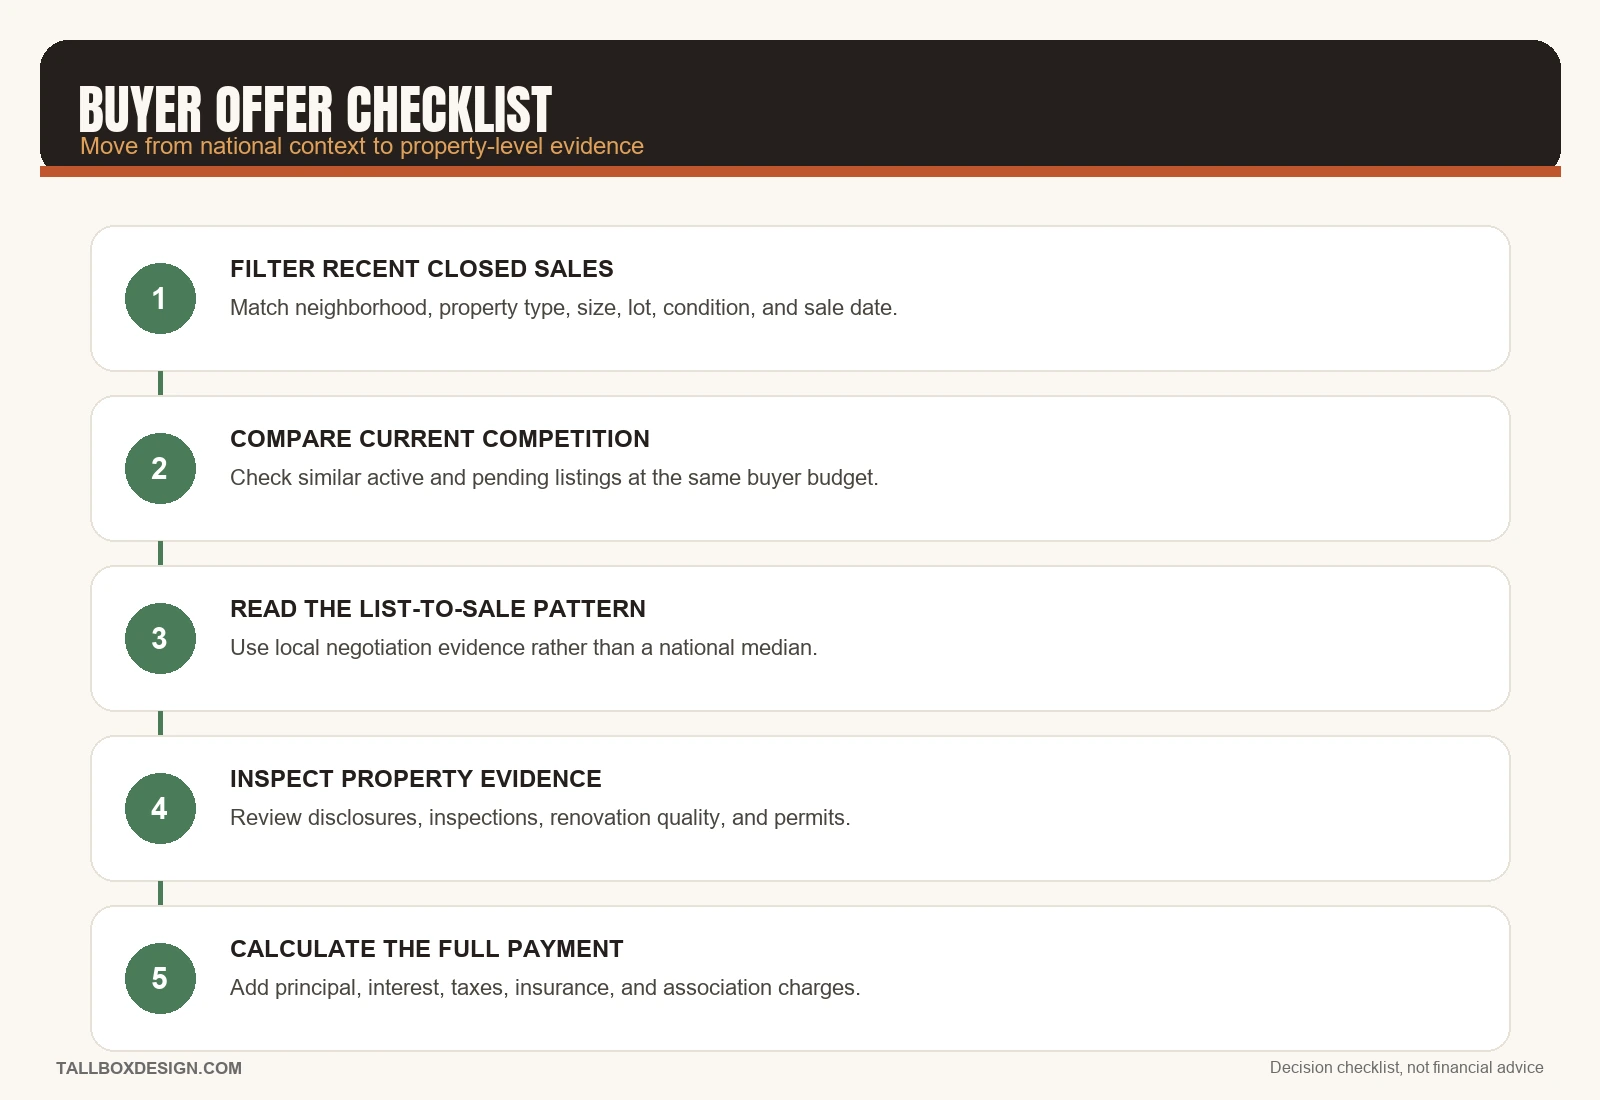
- Filter recent closed sales. Match neighborhood, property type, size, lot, condition, and sale date. One outlier can distort the range, so do not rely on a single comparable home.
- Compare current competition. Check similar active and pending listings to identify the alternatives another buyer faces during the offer period.
- Read the list-to-sale relationship. A local pattern of sales below original list price changes the negotiating range more directly than a national median.
- Inspect property evidence. Disclosures, inspection findings, renovation quality, and unpermitted work can justify a property-specific adjustment.
- Calculate the full payment. Add principal, interest, property tax, insurance, and association charges before setting the offer ceiling.
An AI listing search cannot verify condition, permits, or ownership. Tallbox’s AI home-search checklist covers those checks.
A defensible offer comes from local closed evidence, live alternatives, property facts, and the buyer’s payment limit.
Which housing price matters before a seller lists?
A seller’s list price starts with weighted local sales, then adjusts for active competition instead of copying the national record.
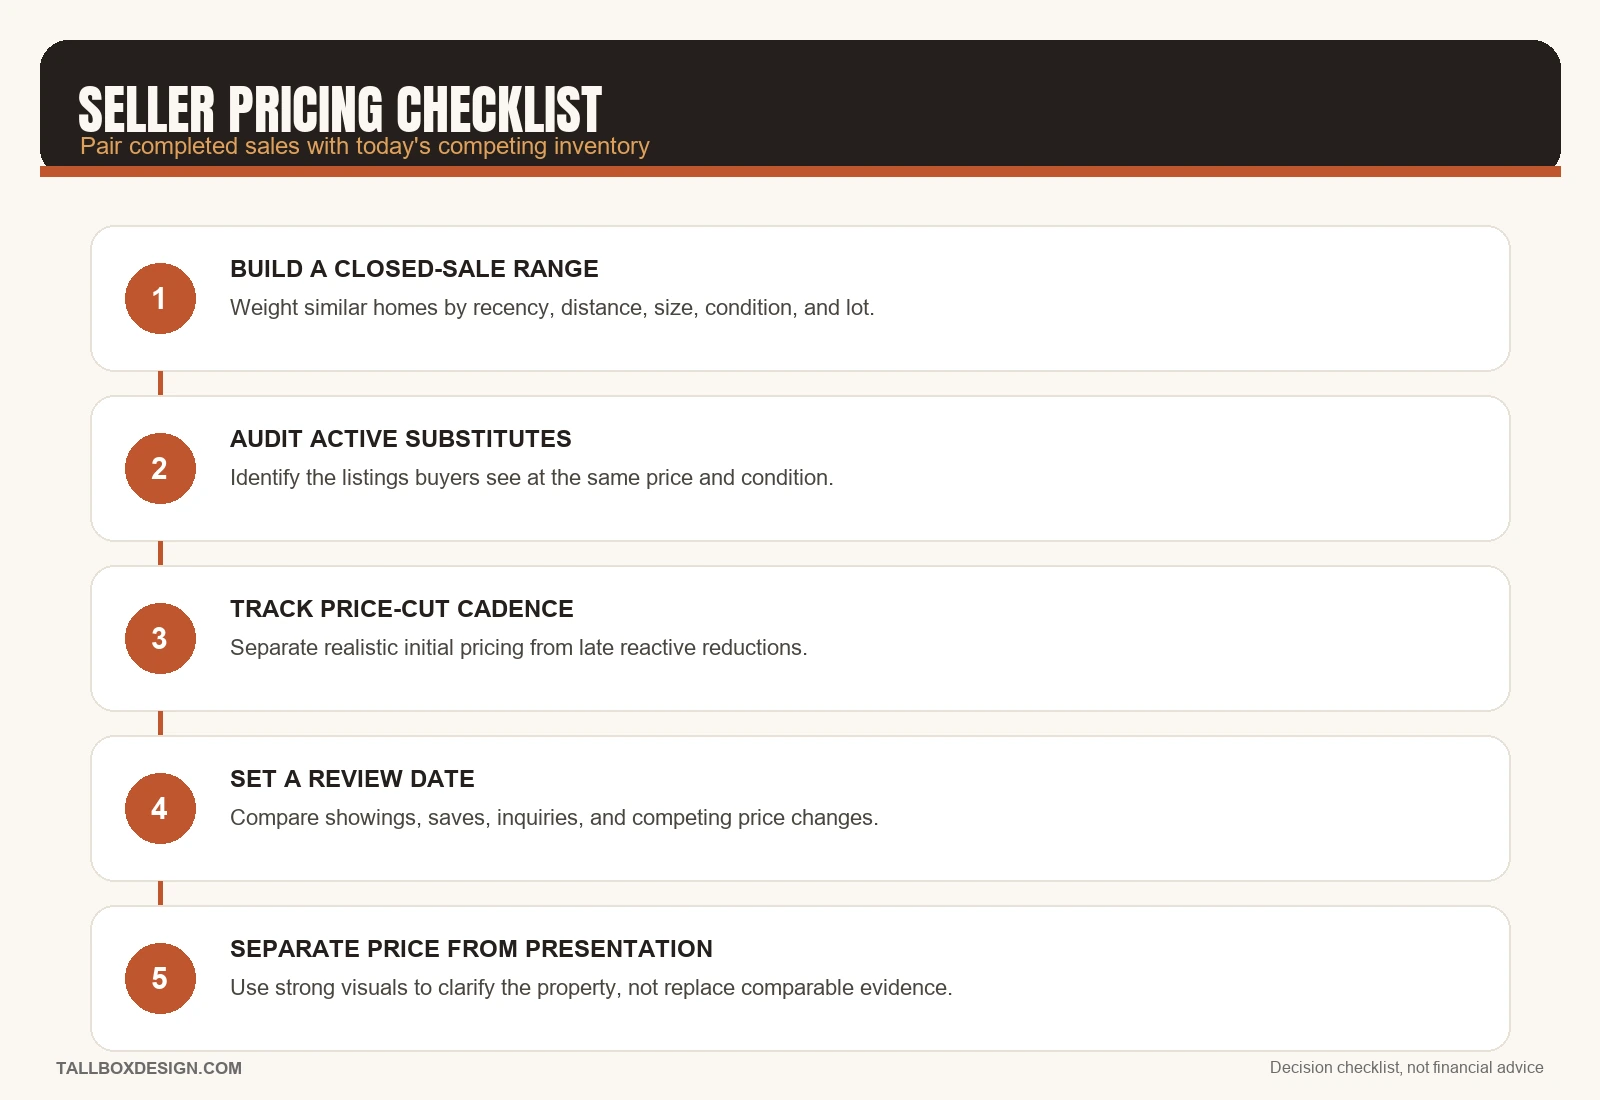
- Build a closed-sale range. Weight similar homes by recency, distance, size, condition, and lot rather than choosing the highest nearby sale.
- Audit active substitutes. Identify listings at the same budget and note differences in presentation and repair needs.
- Track price-cut cadence. Realtor.com recorded cuts on 18.8% of June listings, 1.9 points below a year earlier. Lower asks may reflect realistic pricing, but regional mix and demand remain alternatives.
- Set a review date. Choose the date before launch, then compare showings, saves, inquiries, and competing price changes on that date.
- Separate price from presentation. Photography, plans, staging, and accurate descriptions help buyers assess the home but do not replace comparable-sale evidence.

An asking price records a seller’s position; a completed sale records the agreed price. Tallbox’s analysis of sellers pulling homes off the market examines exposure, reductions, and withdrawal without blaming the national median.
The June 2026 record sale price and falling asking price measure different samples at different stages of the same market. Buyers and sellers should use the measure whose sample, geography, and transaction stage match their decision.
Sources and methodology
The June 2026 housing-price analysis relies on Redfin’s closed-sale report, Redfin’s Data Center methodology, Realtor.com’s active-listing report, and Freddie Mac’s mortgage-rate series published by FRED.
- Redfin June 2026 housing market report
- Redfin Data Center methodology
- Realtor.com June 2026 housing trends report