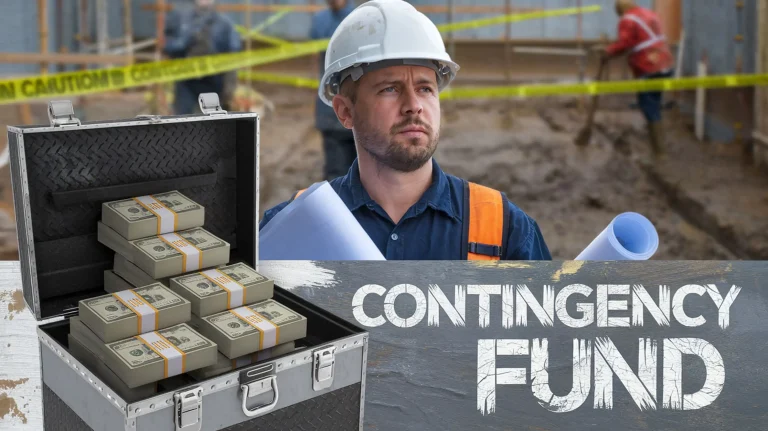
real estate market trends for BRRR in 2025
The BRRRR strategy remained a viable approach in 2024 but required increased diligence, adaptability, and strategic planning due to shifting real estate conditions. In 2025–2026, investors must stay informed and responsive to market headwinds and regulatory changes.
BRRRR investors should prepare for longer holding periods between refinancing and focus on markets well-suited for this strategy.
Pros
- Generates rental income and cash flow
- Builds equity and expands portfolios with limited initial capital
- Benefits from economies of scale with multiple properties
- Leverages property value appreciation when conditions permit
Cons
- Slower property appreciation in 2025 may hinder refinancing
- Higher interest rates raise borrowing costs
- Tighter lending standards complicate refinancing
- Demands significant time and involvement at each stage
- Exposes investors to risks such as cost overruns, vacancies, and value declines

George is a seasoned interior designer and property marketing strategist with over 13 years of experience. He specializes in transforming properties into visually stunning spaces, helping clients recognize the potential and beauty in each property. With an impressive international client base of exciting projects throughout Europe and America.
Overview of the BRRRR Strategy
BRRR stands for Buy, Rehab, Rent, Refinance, Repeat. This strategy focuses on keeping renovated properties as rentals, then using cash-out refinancing to fund the next purchase. Unlike traditional flipping, BRRRR builds long-term income while reusing your initial investment. David Greene’s book outlines a step-by-step system for creating passive income through this method.
- Buy: The first step is to purchase a property, ideally below market value, that requires some form of rehabilitation.
- Rehab: After acquisition, the property is improved to increase its value and appeal to tenants.
- Rent: Once the rehab work is completed, the property is rented out to generate income.
- Refinance: After the property is rented and demonstrates stable income, the investor refinances the property, ideally at a higher value due to the improvements made.
- Repeat: The equity gained from the refinance is then used to finance the next property purchase, repeating the cycle
BRRR success starts with detailed property analysis. Look for homes priced at 70–75% of their after-repair value minus renovation costs. Ideal properties have strong rental demand, manageable rehab needs, and enough equity to support refinancing. Greene’s book includes spreadsheets and formulas to help evaluate potential deals using these criteria.
In 2024, this strategy remained favourable property investment method despite the turmoil in the real estate markets around the globe, with certain adaptations and considerations due to the evolving market dynamics many investors manged to adapt and move prepared for 2025.
Pros and Cons of the BRRRR Strategy:
Pros:
- Minimal Initial Capital Needed: This approach is favorable for investors with limited funds, focusing on adding value to undervalued properties.
- High Return on Investment (ROI): The cash flow from rental income can exceed the debt service, leading to a high ROI.
- Increased Equity: Rehabilitation increases the property’s value and rental income.
- Reliable Tenants: Renovated properties tend to attract better tenants.
- Scalability: This method can be repeated, allowing for growth in property holdings.
Cons:
- Risk of Overestimating Rental Revenue: Overestimation can delay the cash-out process.
- High Costs of Hard Money Loans: These loans can be expensive, affecting ROI.
- Appraisal Risk: If the property does not appraise well post-rehab, it limits the ability to extract equity.
- High Leverage Risks: Market downturns could lead to financial difficulties.
- Vacancy Risks: Market drops could lead to vacancies and potential foreclosures
How to find BRRRR deals in 2025

What to look for, where, how to identify good deals?
Step 1: Understand the BRRRR Method
The BRRRR method stands for Buy, Rehab, Rent, Refinance, Repeat. It involves:
- Buying an undervalued property
- Renovating and rehabbing the property
- Renting out the property to generate rental income
- Refinancing the property to pull out capital for the next deal
- Repeating the process
This allows investors to build a rental portfolio with little capital.
Step 2: Research and Analyze Potential BRRR Markets
- To find good BRRRR deals look for markets with solid job and population growth, indicating rental demand
- Consider affordability – cheaper areas allow for better cashflow
- Factor in property appreciation trends – markets with upside have more refi potential
- Drive around target neighborhoods to assess demand and property conditions
Step 3: Find Discounted or Distressed Properties
- Look for pre-foreclosures, foreclosures, short sales, bank-owned properties
- Search sites like Zillow, Realtor.com, auction sites for distressed listings
- Drive for dollars – look for signs of neglect like overgrown lawns, peeling paint
- Look for probate/inheritance sales through county records or attorneys
- Network with realtors, wholesalers, contractors etc. to find off-market deals
- Search public records for lis pendens filings and foreclosure notices
Step 4: How to Analyze BRRRR Deal
- Estimate rehab costs with a contractor walkthrough
- Calculate ARV (after repair value) based on comps
- Determine max purchase price using the 70% Rule (Purchase + Rehab ≤ 70% of ARV)
- Project rental income and expenses to estimate cashflow
- Account for holding costs during rehab period
Step 5: Secure BRRRR Financing
- Use private money, hard money loans, cash partners to fund the purchase and renovation
- Shop around with multiple lenders to find the best terms
- Once rehabbed, get an appraisal and refinance into a conventional loan to pull out capital
Step 6: Repeat the Process
- Use the capital from refinancing to purchase the next property
- Rinse and repeat! Each deal will fund the next acquisition via the refinance cash-out
The key is finding discounted properties in solid rental markets. Proper macro and micro analysis on the region, local cities and towns with conservative underwriting are critical to account for risks and ensure successful execution.
Macro Analysis of 2025 Real Estate Trends

Geopolitical uncertainty continues to drive market volatility, especially through shifting trade policies. Proposed global tariffs of 10% could raise home construction costs by 0.7%, slowing the recovery of housing supply. Changes in immigration policy add further pressure, with stricter visa rules potentially shrinking the construction workforce by up to 12% and delaying an estimated 140,000 housing units each year.
Key Economic Factors Influencing Real Estate in 2025
The 2025 real estate market operates within a shifting economic landscape marked by moderating inflation, cautious monetary policy, and changing demographics. Mortgage rates for 30-year fixed loans remain high, ranging from 6.3% to 6.8%, even after modest rate cuts that lowered the federal funds rate to around 4%. This persistent high-rate environment continues to strain housing affordability. However, if inflation trends continue downward, mortgage rates could ease to around 5.9% by year-end.
Economic growth remains modest, with 2025 GDP expected to rise 2.0%, slightly above last year’s 1.8%. Recession risks persist, with forecasts showing a 30–58% chance of contraction. The labor market remains steady, with unemployment at 3.9%, though wage growth has slowed to 3.1%, now more in line with productivity. This helps ease inflation but also limits consumer buying power in expensive markets.
Inflation has dropped from its 2022 peak but is still above the Federal Reserve’s 2% target. As of April 2025, the Consumer Price Index rose 2.4% year-over-year. Housing costs remain elevated, rising 4–5%, due to ongoing supply issues. Residential construction continues to lag, with material prices up 18% since 2022 despite improvements in supply chains.
Sector-Specific Impacts
Multifamily: Moderating Growth Amid Supply Wave
The multifamily sector faces pressure from a record 420,000 new units delivered in 2025 across major metros. This supply increase has slowed national rent growth to 3.5%, with wide regional differences. Sun Belt markets like Phoenix (-1.2%) and Austin (-2.5%) now see flat or falling rents as absorption lags behind new construction.
In contrast, Midwest cities such as Indianapolis, Milwaukee, and Columbus show stronger performance, with vacancy rates below 4% and rent growth above 5%. This trend reflects relative affordability and growing climate migration, with 14% of new residents citing extreme weather avoidance. Build-to-rent communities now make up 11% of single-family construction starts, as institutional investors target stable returns through managed rental portfolios.
Office Market: Adapting to Hybrid Reality
The office sector continues to adjust post-pandemic, with national vacancy rates steady at 18.2%, reflecting the lasting impact of hybrid work. Demand is split: Class A buildings in prime locations have seen vacancies drop to 12.4% as tenants consolidate into higher-quality spaces, while Class C properties face vacancy rates above 24%, driving adaptive reuse. Since 2023, over 25 million square feet of outdated office space has been converted to residential or healthcare uses.
Net absorption remains negative in most downtown areas but is slowing. Suburban office parks and edge cities show more stability, with vacancy rates improving by 410 basis points to 14.3%, supported by “hub-and-spoke” models that reduce commute times. Office designs now emphasize collaboration and flexibility, with 38% of firms adopting hot-desking to increase space efficiency.
Industrial: Sustained Strength with Regional Shifts
Industrial real estate remains the strongest commercial sector in 2025, driven by e-commerce, which now accounts for 22% of total retail sales. National vacancy rates are low at 5%, though regional differences have emerged. The Inland Empire and Southern California face rising vacancies near 7% due to oversupply, while East Coast port-adjacent facilities maintain sub-3% vacancies as companies regionalize supply chains.
The sector has expanded beyond standard warehouses. Specialized assets like cold storage, data centers, and manufacturing facilities now command premium rents. Last-mile facilities within 20 miles of major cities have seen 9.2% rent growth, reflecting strong demand for urban logistics. Reshoring has further boosted demand for manufacturing space, pushing industrial construction starts up 15% year-over-year despite high material costs.
Retail: Renaissance Through Repositioning
Retail properties continue to recover, with national vacancy rates falling to 5.8% as the sector rebalances through closures and adaptive reuse. Experiential retail leads growth, with food, fitness, and entertainment tenants making up 42% of new leases. Neighborhood centers anchored by essential retailers remain strong, with 97% occupancy and 3.8% annual rent growth.
The mall sector remains divided. A-tier malls have reached 91% occupancy by adding mixed-use elements, while C-tier malls remain below 75%. Retail is increasingly blending with other sectors, as 34% of new leases go to service-oriented tenants like healthcare and education providers—reflecting consumer demand for convenience and community-focused spaces.
Hotels: Uneven Recovery Continues
The hospitality sector continues its recovery, with national occupancy reaching 65.3%, nearing pre-pandemic levels despite uneven market performance. Business travel remains 15% below 2019 levels but has stabilized as companies define travel policies for hybrid teams. Leisure travel drives growth, with resorts and experiential properties posting 72% occupancy and 6.2% annual rate increases.
Urban markets show mixed trends. Cities like New York and San Francisco have regained occupancy but lag in rate growth due to slower business travel recovery. Limited-service hotels in suburban and highway-adjacent areas remain stable, supported by both leisure demand and blended business-leisure trips. Investment has returned, with $22 billion in transactions year-to-date, though financing is selective and underwriting remains strict compared to other commercial sectors.
Real Estate Investment Trends
Annual transaction volume across all property types has stabilized at $450 billion—25% below the 2021 peak but signaling a functioning market despite higher borrowing costs. Private capital now drives 68% of activity, as institutional investors remain selective. The bid-ask spread has narrowed to 5–7%, down from 12–15% in 2023, showing improved price alignment and seller acceptance of higher cap rates.
Lending standards remain tight, with average loan-to-value ratios at 60–65%, down from the 70–75% range seen during the last cycle peak. While debt markets remain active, caution from regional banks has expanded the role of alternative lenders. Debt funds and insurance companies now account for 34% of commercial originations. Debt service coverage ratios are conservative at 1.4–1.5x, offering a buffer against economic softening.
Cap rates have risen across all sectors. Multifamily has shifted from 3.5–4% lows to 5.3–5.8%. Industrial assets hold the lowest cap rates at 4.8–5.3%. Retail (6.2–7.5%) and office (7.5–9.0%) reflect higher perceived risks. Value-add strategies have gained traction, with investors targeting operational improvements and repositioning over pure appreciation.
Caution around potential distress has increased, especially in office and weaker retail segments. Foreclosures are up 20% year-over-year, but broad distress has been limited by conservative leverage and lender flexibility. The denominator effect from public market declines has eased, though institutional investors remain selective in new allocations.
Emerging BRRRR Markets for 2025
Investors gain clearer insights by combining economic data, market analysis, and local observations. While macro trends provide context, detailed, block-by-block research reveals emerging submarket opportunities and supports smarter acquisition decisions.
- Study population growth, job growth, and migration patterns to gauge market demand
- Research permit activity to track new construction and inventory trends
- Analyze rental rates, vacancies, and absorption to assess multifamily dynamics
- Review retail and office lease rates and vacancies to understand commercial real estate conditions
- Look at housing inventory, sales data, and days on market to measure residential market strength
- Evaluate median home prices, affordable price points, and price per square foot for valuation guidance
- Check lending activity, foreclosures, and delinquencies to identify risks or opportunities
- Review infrastructure projects, zoning changes, and development plans that will shape future growth
- Drive the market to observe real-time conditions not captured in the data
Key Attributes of Ideal Brrrr Markets
Tracking key attributes of ideal BRRRR markets requires a multifaceted approach. Here are some steps to help you monitor these factors effectively:
1. Economic Growth
- Data Sources: Utilize economic reports and forecasts from reliable sources like government economic agencies, real estate research firms, and financial institutions.
- Key Indicators: Look for GDP growth rates, employment trends, and business activity in the area.
2. Rental Yield
- Local Market Research: Investigate local real estate listings and rental websites to understand average rental prices.
- Property Analysis Tools: Use online tools and calculators that provide insights into potential rental yields based on property value and expected rent.
3. Population Growth and Demographics
- Census Data: Monitor census data for insights into population growth, migration patterns, and demographic changes.
- Local News and Reports: Stay informed about local developments, infrastructure projects, and other factors that might attract people to the area.
4. Real Estate Market Trends
- Real Estate Market Reports: Regularly review reports from real estate agencies and industry groups for trends in property prices, sales volume, and inventory levels.
- Networking: Engage with local real estate agents, investors, and property managers for firsthand insights.
5. Supply and Demand Dynamics
- Construction Data: Track new construction projects and building permits to understand supply changes.
- Vacancy Rates: Monitor vacancy rates, as they can indicate the balance between supply and demand in the rental market.
6. Local Economic Factors
- Employment Sectors: Analyze the strength and diversity of local employment sectors. A diverse job market can mean a more stable tenant base.
- Major Employers and Industries: Keep track of major employers and any news of expansions or layoffs.
7. Government Policies and Regulations
- Zoning and Development Laws: Stay informed about changes in local zoning and development regulations.
- Tax Policies: Understand property tax rates and any potential changes that could affect investment returns.
8. Infrastructure and Services
- Transportation and Amenities: Evaluate the quality and accessibility of local transportation, schools, healthcare facilities, and other amenities.
- Future Development Plans: Be aware of planned infrastructure or service improvements that could enhance property values.
9. Geopolitical and External Factors
- Global and National Trends: Keep an eye on broader geopolitical events and economic trends that could indirectly impact local markets.
- Risk Assessment: Consider risks like natural disasters or economic downturns and their potential impact on the market.
Tools and Resources
- Real Estate Analytics Platforms: Utilize platforms that aggregate and analyze real estate data.
- Investment Forums and Seminars: Attend forums and seminars to gain insights from experts and peers.
By systematically tracking these attributes, investors can better identify ideal BRRRR markets and make informed decisions about where to invest. It’s also important to regularly review and adjust your strategies based on the latest data and market conditions.
Financial Aspects in Brrrr Investing in 2025
Successful BRRRR investing requires meticulous financial planning, from choosing the right refinancing options to conducting a comprehensive cost-benefit analysis.
It’s important to stay informed about lending practices and real estate market trends, build strong relationships with financial institutions, and continuously assess the financial viability of your investments. This approach will help in maximizing returns while mitigating risks in BRRRR investing.
Managing the financial aspects of BRRRR (Buy, Rehab, Rent, Refinance, Repeat) investing involves several key steps, including understanding refinancing options and conducting a thorough cost-benefit analysis. Here’s an overview of how to approach these aspects:
1. Refinancing Options
Refinancing is a crucial step in the BRRRR strategy, as it allows investors to extract equity from the rehabilitated property. Understanding the various refinancing options available is essential:
- Traditional Mortgage Refinancing: After rehabilitating the property and stabilizing it with rental income, you can approach traditional mortgage lenders for refinancing. This option often provides lower interest rates compared to hard money loans.
- Hard Money Loans: These are short-term loans with higher interest rates, useful for initial property acquisition and rehab. Investors usually refinance these loans with traditional mortgages once the property is stabilized.
- Cash-Out Refinance: This involves refinancing for a higher amount than what you owe on the existing mortgage, allowing you to pull out cash from the property’s equity.
- Portfolio Lenders: These lenders offer more flexibility and might be more understanding of investors’ strategies. They are particularly useful when conventional lenders are not an option.
- Government-Backed Loans: Options like FHA and VA loans might be available, but they come with specific requirements and limitations.
2. Cost-Benefit Analysis
Conducting a cost-benefit analysis is vital to ensure the profitability of a BRRRR investment:
- Calculate Total Investment Cost: Include the purchase price, closing costs, rehab costs, holding costs, and refinancing costs.
- Estimate After-Repair Value (ARV): Determine the potential value of the property after rehabilitation. This is crucial for refinancing and understanding the equity you can extract.
- Analyze Rental Income: Estimate the rental income the property can generate. This should cover all expenses, including mortgage payments, taxes, insurance, and maintenance, while providing positive cash flow.
- Consider Market Trends: Keep an eye on the real estate market trends to ensure your investment aligns with current and future market conditions.
- ROI Calculation: Calculate the return on investment, considering the cash flow and equity gained through the process.
- Risk Assessment: Identify potential risks, including market downturns, unexpected repair costs, or vacancy rates, and plan accordingly.
3. Financial Institutions and Resources
- Lender Relationships: Build relationships with various lenders, including banks, credit unions, and private lenders, to understand their lending criteria and interest rates.
- Financial Advisors and Mortgage Brokers: Consult with financial advisors or mortgage brokers who specialize in investment properties to get the best financing deals and advice.
Risks and Challenges in Brrrr investing 2025
Key Risks and Challenges
- Overpaying for properties – Paying too much for distressed properties eats into potential profits. Thoroughly research comps and use conservative estimates for ARV.
- Cost overruns during rehab – Unexpected repairs and delays can blow rehab budgets. Get detailed contractor estimates, build in buffers, and inspect regularly.
- Overestimating ARV – Being too optimistic about potential value post-rehab results in lower refinance proceeds. Use conservative ARV estimates based on recent comparable sales.
- Not finding tenants quickly – Vacancies lead to carrying costs that strain cash flow. Price rents competitively and budget for vacancy costs in projections.
- Refinancing challenges – Inability to refinance on favorable terms prevents pulling out capital for the next deal. Maintain reserves and be prepared to hold properties longer if needed.
- Lack of exit strategy – Having a plan in place to sell if needed provides flexibility to take profits or cut losses. Track market conditions in case a sale becomes advantageous.
Read also: To Flip or BRRRR?
Strategies to Mitigate Risks
- Thorough market research and conservative underwriting
- Detailed contractor estimates and rehab buffers
- Regular property inspections during renovations
- Building relationships with private lenders
- Planning for longer hold periods if refinancing is delayed
- Maintaining capital reserves to cover unexpected costs
- Networking to stay informed on market conditions
- Willingness to pivot investment strategy as needed
Successful BRRRR execution relies on the 70% rule: the maximum purchase price should equal 70% of the after-repair value (ARV) minus renovation costs. For example, a property with a $300,000 ARV and $50,000 in rehab costs supports a purchase price of $160,000. Midwest markets often provide properties that meet this criteria, especially in inner-ring suburban areas undergoing revitalization through targeted rehabilitation.
Midwest Dominance in Value-Add Opportunities
In 2025, the BRRRR (Buy, Rehab, Rent, Refinance, Repeat) strategy is most effective in Midwest markets, where acquisition costs remain below replacement value. Toledo leads with a median home price of $235,000—43% below the national average—and gross rental yields over 9%. Renovation costs are also lower, averaging $15–25 per square foot versus $35–50 in coastal markets.
Midwest Dominance in Value-Add Opportunities
In 2025, the BRRRR (Buy, Rehab, Rent, Refinance, Repeat) strategy is most effective in Midwest markets, where acquisition costs remain below replacement value. Toledo leads with a median home price of $235,000—43% below the national average—and gross rental yields over 9%. Renovation costs are also lower, averaging $15–25 per square foot versus $35–50 in coastal markets.
Other strong BRRRR markets include Indianapolis, where a $180,000 median home price and $1,700 average rent produce a 1% monthly rent-to-price ratio. Memphis offers even lower entry points, with a $130,000 median price and $1,500 average rent. Both cities benefit from limited new construction, maintaining supply constraints that support value-add strategies and renovation-driven equity growth.
Florida - Value-Add Opportunities
Orlando, Tampa, Jacksonville and secondary Florida cities appear to offer the best combination of rental demand and cheaper housing costs suitable for BRRRR deals in the current market. Thorough planning and preparation is key to successfully implementing BRRRR in these areas.
- Orlando – Strong tourism industry and job growth drives rental demand. Zip Codes FL 32808; 32818; 32789 tend to have foreclosures on sale. Target secondary cities with lower home prices like Kissimmee.
- Tampa – Major metro with robust job growth and in-migration. Focus on building relationships with private lenders. Zip Codes FL 33603; 34690; 34691; 33510; 33610 have often foreclosure properties
- Jacksonville – Benefits from affordable housing and steady population growth. Look for discounted properties to fix up around Zip Codes 32641; 32038; 32220; 32696
- Miami – High rents but zoning restrictions on short-term rentals. Find properties in Zip Codes 33322; 32220; 33324; 33020;33023;
- Fort Lauderdale – Popular with young professionals moving to the area. Look for distressed properties in Zip Codes 33301; 33304; 33308; 33312; 33319. Join local REIA groups and attend meetings to network and find potential deals.
- Secondary cities like Spring Hill, Lehigh Acres, Palm Bay offer cheaper housing costs and solid rental demand fundamentals. Look at Zip Codes 34609; 34608; 34604; 33936; 33971; 33972; 33974; 33976 and 32905; 32907; 32909
- Market-specific research is key to identify best opportunities and neighborhoods. Focus on job/population growth.
- Conservative underwriting is essential as appreciation is slowing. Plan for longer hold periods before refinancing.
- Building relationships with private lenders is crucial to secure financing for deals.
How to read economic forecasts and urban development plans?
BRRRR - Tourism and rental demand in Orlando
For example, Orlando’s strong tourism industry (Universal’s Islands of Adventure, The Wizarding World of Harry Potter and Magic Kingdom Park) drive job growth and create a high demand for rental properties. Foreclosed properties in zip codes like FL 32808 and 32818 offer potential for profitable Brrrr deals.
Similarly, Tampa’s robust job market with unemployment rate at 2.6% and in-migration patterns make it attractive for Brrrr investors.
The availability of foreclosed properties in zip codes such as FL 33603 and 34691 further adds to its appeal. However, investors must be cautious as these markets can react unpredictably to economic shifts.
For example, an investor focusing on Jacksonville’s real estate market, particularly for BRRRR deals, can consider properties near key tourist attractions like the Cummer Museum of Art & Gardens (829 Riverside Avenue), Catty Shack Ranch Wildlife Sanctuary (1860 Starratt Road), or Kingsley Plantation (11676 Palmetto Avenue).
These locations, known for their cultural and historical significance, attract consistent foot traffic, making nearby properties potentially lucrative for rental demand.
However, challenges such as zoning regulations or higher property costs in these areas could impact the investment strategy.
To capitalize on these opportunities, investors should conduct in-depth market research focusing on rental demand trends and property prices in these areas. Engaging with local real estate agents knowledgeable about Jacksonville’s unique market dynamics and tourist-driven economy can provide valuable insights.
Understanding local regulations, especially those related to zoning and rentals near tourist sites, is crucial for making informed investment decisions.
Proactive networking with private lenders and local real estate investment groups can also open doors to potential deals and financing options.
BRRRR - Tourism and rental demand in Fort Lauderdale
In Fort Lauderdale, popular with young professionals, an investor might focus on distressed properties in areas like 33301, 33304, 33308, 33312, or 33319. These zip codes are near major attractions like Fort Lauderdale Beaches, Las Olas Boulevard, the Fort Lauderdale Riverwalk, and Bonnet House Museum & Gardens.
These attractions draw consistent crowds, potentially increasing rental demand. However, one must be cautious about the state of distressed properties and the cost of renovations, as well as navigating the competitive real estate landscape.
To maximize returns, an investor or flippers should align their property searches with areas that show high potential for growth, like those near key tourist attractions. Networking with local real estate investment groups and attending REIA meetings can uncover valuable insights and off-market deals.
Understanding the preferences and lifestyle of young professionals can guide renovation and marketing efforts, making these properties more attractive to potential tenants.
Depending on the investment strategy balancing the cost of acquisition and renovation with the expected rental income is crucial for a successful investment.
To find the best deals, investors should cast a wide net by checking public foreclosure notices, connecting with real estate agents selling bank-owned properties, and networking at local REIA meetings.
Building relationships with private lenders positioned to fund deals is key. Patience and persistence is required to uncover hidden opportunities.
Secondary Cities with Economic Diversification
Beyond traditional Midwest strongholds, secondary cities with diverse economies have become promising BRRRR targets. Birmingham (Alabama), Montgomery (Alabama), Omaha (Nebraska), and Dayton (Ohio) offer price-to-rent ratios below 12 and favorable demographic trends. These cities combine affordable acquisition costs ($95,000–$210,000 median prices) with strong economic performance, reflected in unemployment rates below the national average.
They share characteristics favorable to BRRRR strategies: limited new construction that restricts housing supply, municipal programs that promote neighborhood revitalization, and growing workforces drawn by affordability and quality of life. Birmingham illustrates this trend, with expanding healthcare and technology sectors increasing rental demand while housing costs remain 60% below the national average.
Climate Resilience as Emerging Criterion
Climate factors increasingly shape BRRRR market selection. Inland cities with low exposure to floods, wildfires, and hurricanes now attract more investment than vulnerable coastal or western areas. Cleveland, Columbus, and Indianapolis score well in climate risk assessments, with FEMA classifying over 80% of their residential zones as minimal-risk.
This climate advantage leads to lower insurance premiums (15–30% below national averages) and fewer renovation needs for environmental hardening. Climate-focused private equity funds have invested over $45 billion in resilient markets, offering potential exit strategies for BRRRR investors who stabilize properties in these areas.
Why look at average property prices to identify to Flip or BRRRR
Average property prices are a useful metric to narrow down advantageous markets and submarkets for flipping or BRRRR based on affordability, cashflow potential, equity growth, and overall market conditions. Both strategies rely on spreads between purchase price and end values, so assessing relative property costs is key.
Analyzing pricing and valuation trends helps match each neighborhood and submarket to the right investment strategy – lower priced distressed areas for flips, appreciating affordable areas for BRRRR rentals, higher priced rebounds for upscale flips, etc.
The numbers guide investors to where each model will likely thrive.
- Average prices indicate the typical home valuation in an area, which sets expectations for ARV (after repair value) potential. Higher average prices often allow more room for profit on flips.
- Looking at recent price changes – appreciation or depreciation – helps gauge likely short and long term growth potential. Areas seeing strong growth may be better for BRRRR holding, while stagnant or declining areas can be riskier.
- Comparing average prices to median rents provides a sense of price-to-rent ratios and the viability of cashflow from rentals in a BRRRR model. Lower priced areas tend to work better for this strategy.
- Evaluating prices across neighborhoods highlights relative affordability and home conditions. More distressed, lower priced areas often provide bigger margins for flips. Higher priced areas can still work for BRRRR if rents justify.
- Price patterns over time, especially following recessions, can indicate areas primed for gentrification and revitalization – ideal for flips or buy and hold.
Strategy Adaptations for 2025 Conditions
Shifting from Rate Arbitrage to Renovation Value
The BRRRR strategy has evolved from its historical reliance on interest rate arbitrage, where investors benefited from refinancing into lower rates over time. In 2025’s higher rate environment, successful practitioners focus instead on creating substantial forced appreciation through strategic renovations that boost property values beyond market appreciation rates.
This shift necessitates more selective acquisition criteria, with successful investors targeting properties where cosmetic and mid-level improvements can add 30-40% to baseline values. Kitchen and bathroom modernizations, energy efficiency upgrades, and layout optimizations deliver the highest returns, with average renovation ROI ranging from 9-15% in target markets. The refinancing stage now typically occurs at 75% loan-to-value ratios versus the 80-85% common during lower-rate periods, requiring more substantial equity creation to recycle initial capital.
Leveraging Private Lending Relationships
With traditional bank financing constrained by tighter lending standards, BRRRR investors increasingly rely on private lending relationships for acquisition and rehabilitation phases. Local and regional hard money lenders have adapted their products to the strategy, offering 9-11% interest rates on 6-12 month terms specifically structured for the renovation timeframe.
Successful refinancing now often involves FHA and other government-backed loans that offer more favorable rates (5.8-6.2%) than conventional financing, though these require owner-occupation for initial periods. Portfolio lenders specializing in rental properties have expanded their offerings, with debt service coverage ratio (DSCR) loans based on property cash flow rather than borrower income providing exit strategies for investors with multiple properties.
Extending Typical Holding Periods
The typical BRRRR timeline has extended in response to market conditions. Where investors previously aimed to complete the cycle in 6-9 months, successful practitioners now allocate 9-12 months for the full process, with refinancing occurring after at least six months of rental history. This extended timeline accommodates both the higher-rate environment and the more substantial renovation scope required to create sufficient equity for successful refinancing.
Market participants report holding properties through 1-2 rate refinancing windows to capture optimal terms, rather than refinancing immediately after renovation completion. This patience allows properties to season, improving both appraised values and loan terms while generating rental income throughout the holding period. The extended approach emphasizes cash flow sustainability over rapid capital recycling, aligning with broader investor preference for income security in uncertain economic conditions.
Conclusion: Strategic Imperatives for 2025-2026
Real estate continues to face challenges from high interest rates and economic uncertainty, but opportunities remain for investors who adapt to changing market conditions. Effective strategies focus on regional selectivity, renovation-driven value creation, and underwriting that reflects longer holding periods.
Investors should target markets with strong fundamentals—such as select Midwest and Southern cities showing demographic growth, employment diversity, and climate resilience. The BRRRR strategy remains viable but requires stricter criteria than in previous cycles, especially in purchase decisions and refinancing expectations.
Conservative leverage and strong cash flow help protect against potential economic downturns. Some distressed opportunities may arise, particularly in office and overleveraged multifamily sectors, but widespread distress is unlikely due to post-2008 lending discipline.
The year ahead calls for flexible, fundamentals-based investing. Properties with strong rent-to-price ratios, limited new supply, and renovation upside are positioned to perform well across varying economic conditions.