
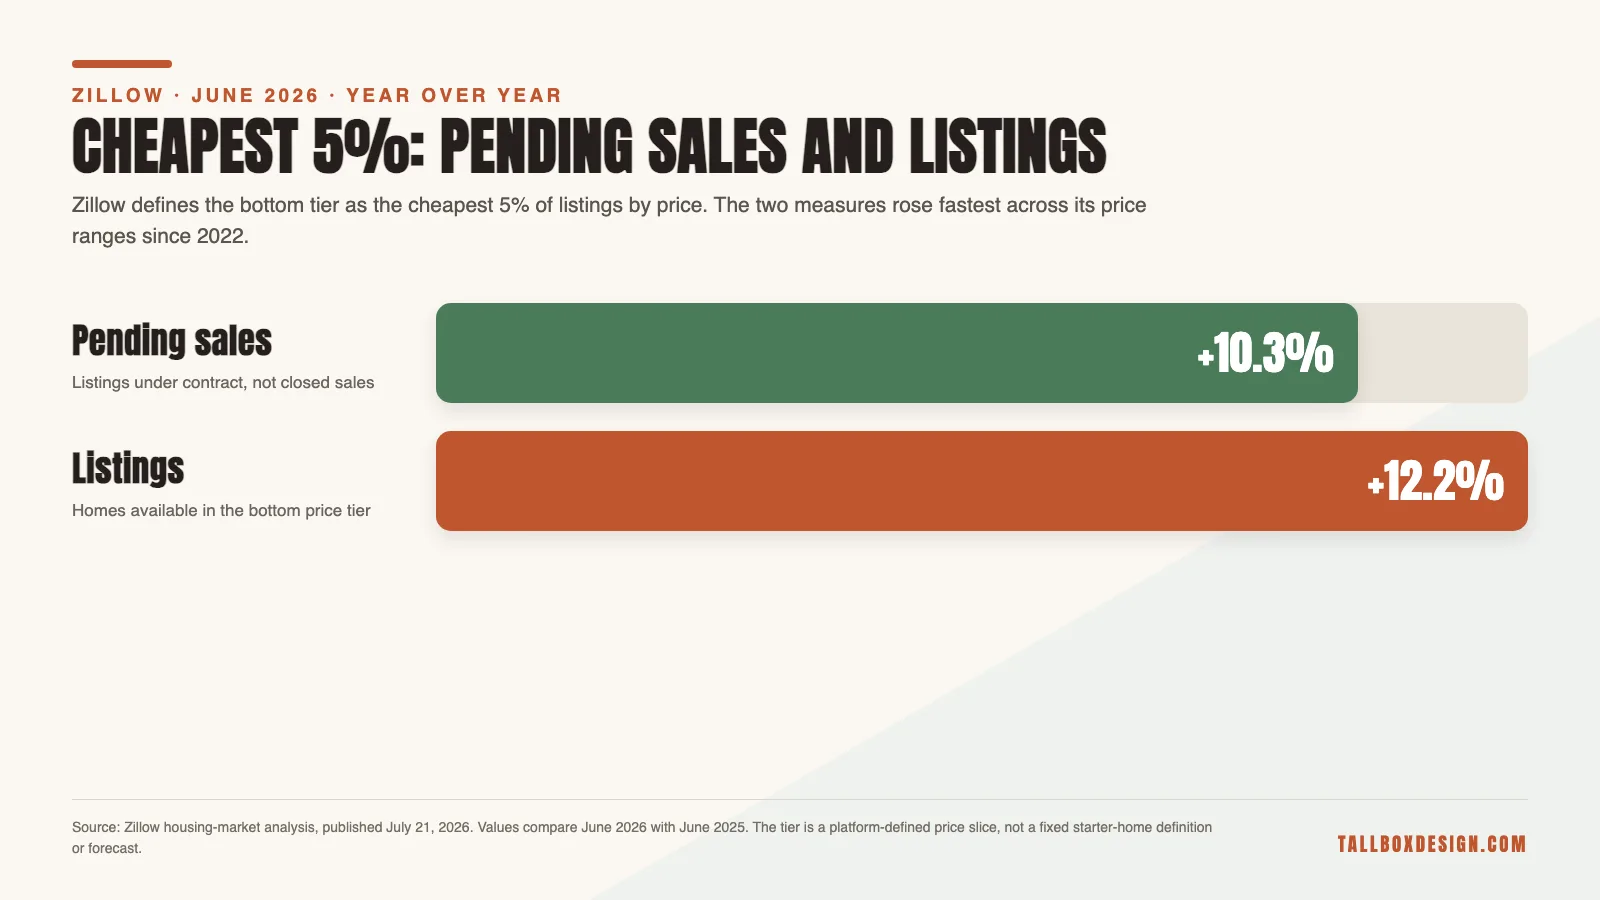
Zillow’s June 2026 reading put the cheapest 5% of listings by price at the front of the rebound. Pending sales rose 10.3% and listings rose 12.2% from a year earlier. For first-time buyers, that platform-defined tier marks faster activity, not a fixed starter-home definition or forecast.
Zillow reported nationwide sales growth beyond the bottom tier. Sales increased 5.9% from June 2025 and 9.2% from May 2026. Freddie Mac’s weekly national average for a 30-year fixed mortgage was 6.55% on July 16, compared with 6.75% one year earlier.
Zillow’s strongest June gains sat at the bottom of its price range, where starter homes are well represented. The 12.2% listing gain gives entry-level shoppers more listings to compare, while the 10.3% pending-sales gain shows that more homes entered contract than a year earlier.
Check listing age, recent comparable sales, financing readiness, condition, dimensions, daylight and recurring costs before assuming the national tier changes one home’s position.
The cheapest 5% posted Zillow’s fastest gains since 2022
Zillow’s cheapest 5% price tier posted the platform’s fastest June 2026 gains. Pending sales in that slice were 10.3% higher than a year earlier, while the number of listings was 12.2% higher.
Bottom-tier pending sales and listings grew faster than the corresponding measures in every other Zillow price range and reached their quickest annual pace since 2022. Pending sales describe homes under contract. Listings describe available supply, so the two figures should be read together without treating them as closed sales.
Zillow Senior Economist Kara Ng connects the tier with starter homes because they are heavily represented at the low end. The 5% boundary is a platform-defined relative threshold, while starter-home prices vary by market.
More bottom-tier listings and below-asking sales change a buyer’s offer check
A 12.2% listing gain gives bottom-tier shoppers more alternatives to compare. Zillow separately reports below-asking sales among homes in this tier. According to Zillow, below-asking sales create negotiating room on individual listings without establishing affordability for every household.
Listing age becomes the first useful local signal. Zillow directs shoppers toward homes that have been available longer, then recommends grounding an offer in recent comparable sales. Zillow treats a longer listing period as a reason to open negotiations, while recent comparable sales supply the address-specific evidence.
Listing age and recent comparable sales connect the national tier data to one address. Property condition, floor-area accuracy, seller circumstances and address-level competition require separate evidence.
Hartford, Chicago, Dallas, Atlanta and Denver split the national rebound
Zillow’s June 2026 metro examples separate two market signals. The median home reached pending status in six days in Hartford and ten days in Chicago. These measures describe contract speed and the short response windows prepared buyers may face in those cities.
Dallas, Atlanta and Denver illustrate Zillow’s June 2026 price-cut signal. Roughly one-third of listings in each metro carried a price cut, according to Zillow. The figures track asking-price changes, while closed-sale data establishes final discounts.
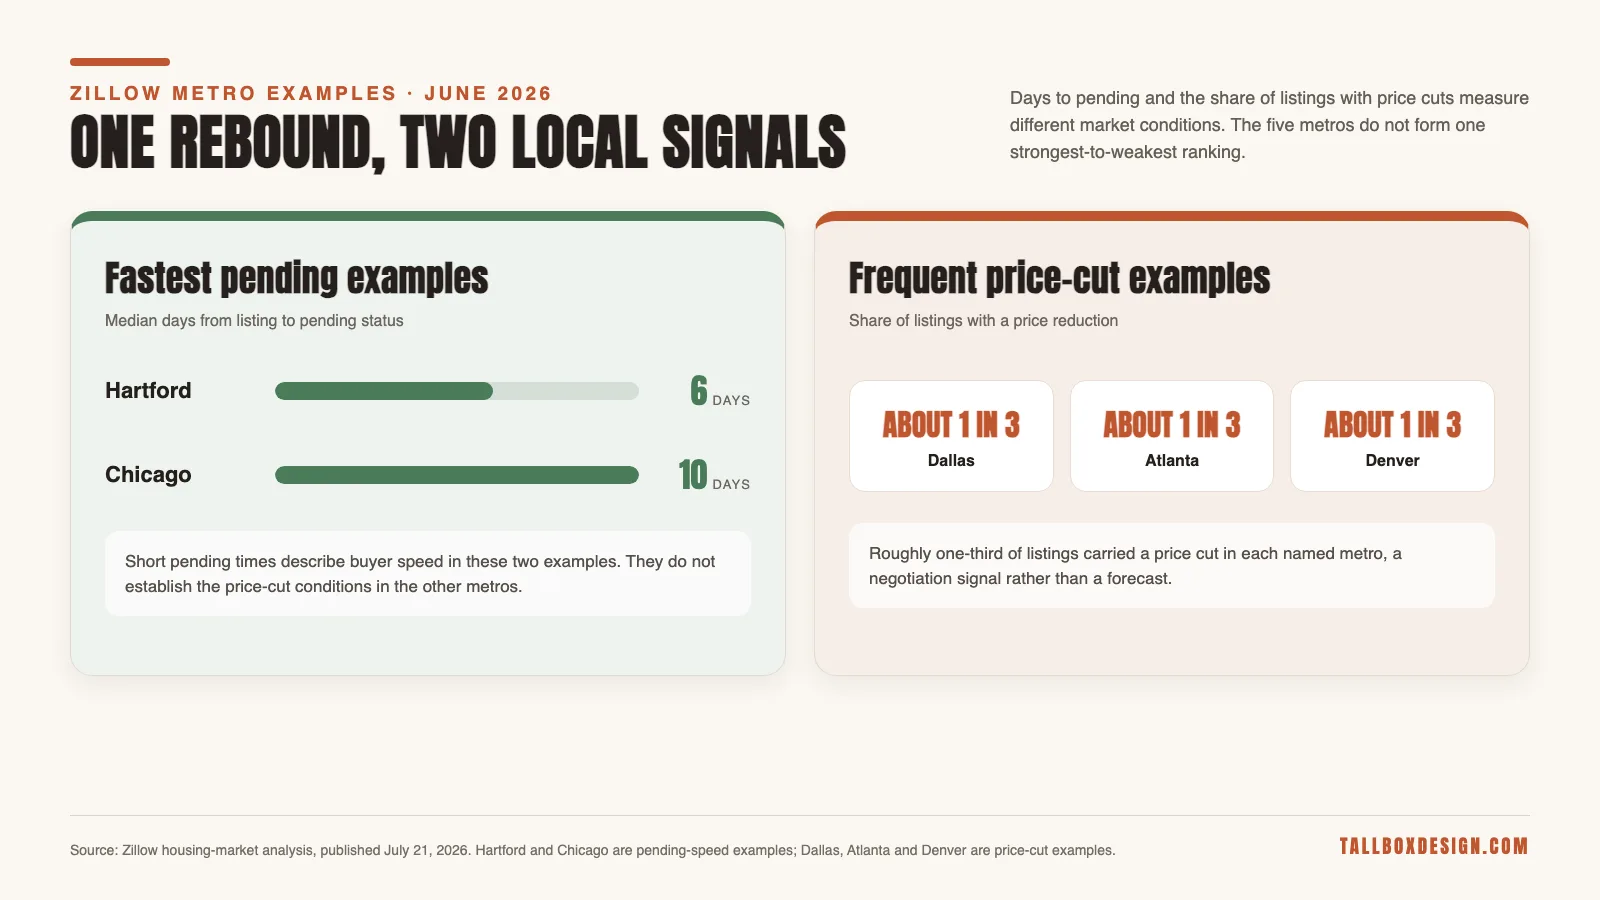
- Hartford: 6 days
- Chicago: 10 days
- Dallas: roughly 1 in 3
- Atlanta: roughly 1 in 3
- Denver: roughly 1 in 3
The national bottom-tier gain therefore needs a metro reading beside it. Completed financing preparation lets a buyer respond within the short contract windows Zillow reports in fast pending markets. Frequent price cuts add asking-price history to a buyer’s comparison. Home documents, property condition and recent local sales remain the address-level evidence.
New listings rose while total inventory growth slowed
New listings in Zillow’s June 2026 data rose 3% from June 2025. Total listings increased only 0.9% over the same period, the smallest annual gain since December 2023. New-listing growth measures fresh market flow, while total-listing growth measures available stock.
The gap between 3% new-listing growth and 0.9% total-listing growth narrows the scope of Zillow’s June rebound. New listings increased 3% from June 2025, but total listing stock was only 0.9% larger than a year earlier. The June figures establish a monthly flow increase rather than a sustained inventory build.
New listings arriving during the period
Total listings available in the market
The 12.2% bottom-tier listing gain exceeded the 0.9% increase in total listings. Zillow’s cheapest slice therefore recorded more choice even as growth in the full listing stock slowed. Buyers still need to check whether added choice exists in their own neighborhood, price band and property type.
What should first-time buyers verify when entry-level homes move faster?
First-time buyers should verify pre-approval, listing age, recent comparable sales and property-level evidence when entry-level listings move faster. Zillow’s guidance begins with pre-approval, listing age and recent comparable sales, which establish a buyer’s financing position and offer context before property-level questions begin.
- 1Confirm the pre-approved price range. A current pre-approval identifies the working range before a fast-moving listing appears.
- 2Read the listing timeline. Note days on market, prior price changes and any return to active status.
- 3Build a recent comp set. Compare nearby sales with similar size, condition, property type and timing.
- 4Verify the property itself. Check dimensions, condition, daylight, recurring costs and local context against documents and direct observation.
A portal shortlist completes the search stage, while dimensions, condition, daylight, recurring costs and local context require separate property evidence. Tallbox’s AI home-search buyer checklist organizes those property-level checks after a home reaches the shortlist.
The four-step financing, listing, comp and property sequence preserves verification when response windows are short. Pre-approval and comp work can happen before a viewing. Property checks then focus limited viewing and inspection time on address-specific facts.
Recent comparable sales still anchor a low-end seller’s price
Recent comparable sales anchor the seller side of Zillow’s guidance. Nearby sales create the starting range. Differences in condition, size and property type require address-specific adjustments to nearby sale results.
The 12.2% year-over-year increase in bottom-tier listings gives buyers more substitutes than in June 2025. Zillow points sellers toward presentation and marketing when shoppers have options. Clear photographs, accurate room information and disclosed condition help a listing show where it sits inside the comp set.
Current nearby evidence sets the starting price, while Zillow’s June figures describe the surrounding market. A listing must make the property’s differences legible to buyers comparing nearby homes in the same tier.
One monthly reading cannot set a starter-home buying timetable
Zillow’s analysis covers June 2026 and compares sales and listing measures with June 2025 or May 2026. The tier is a platform-defined price slice, pending sales are contracts, and listing counts describe supply. Those definitions keep the rebound measurable without turning it into a universal starter-home rule.
Freddie Mac’s 6.55% average for the week ending July 16, 2026, describes a national benchmark rather than an individual quote. Borrower circumstances, loan structure and date affect the rate attached to a specific purchase. The 0.20-percentage-point annual difference describes the national mortgage-rate comparison rather than a household’s affordability.
The June reading’s strongest movement appeared where entry-level homes are concentrated. A local metro reading, listing history, comparable sales and property checks supply the evidence needed to interpret the national rebound.
June’s bottom-tier gains identify where activity accelerated. A buyer’s timing still rests on financing, local conditions and verified property evidence, while a seller’s price still rests on current comparable sales.
Sources and citations
Zillow supplies the principal June figures and guidance, Freddie Mac supplies the mortgage-rate benchmark, and Realtor.com provides independent market context.
- Zillow: The housing market showed signs of life in June. See who’s benefitting most., published July 21, 2026
- Freddie Mac: Primary Mortgage Market Survey, week ending July 16, 2026
- Realtor.com Economic Research: June 2026 Monthly Housing Trends Report, independent market context