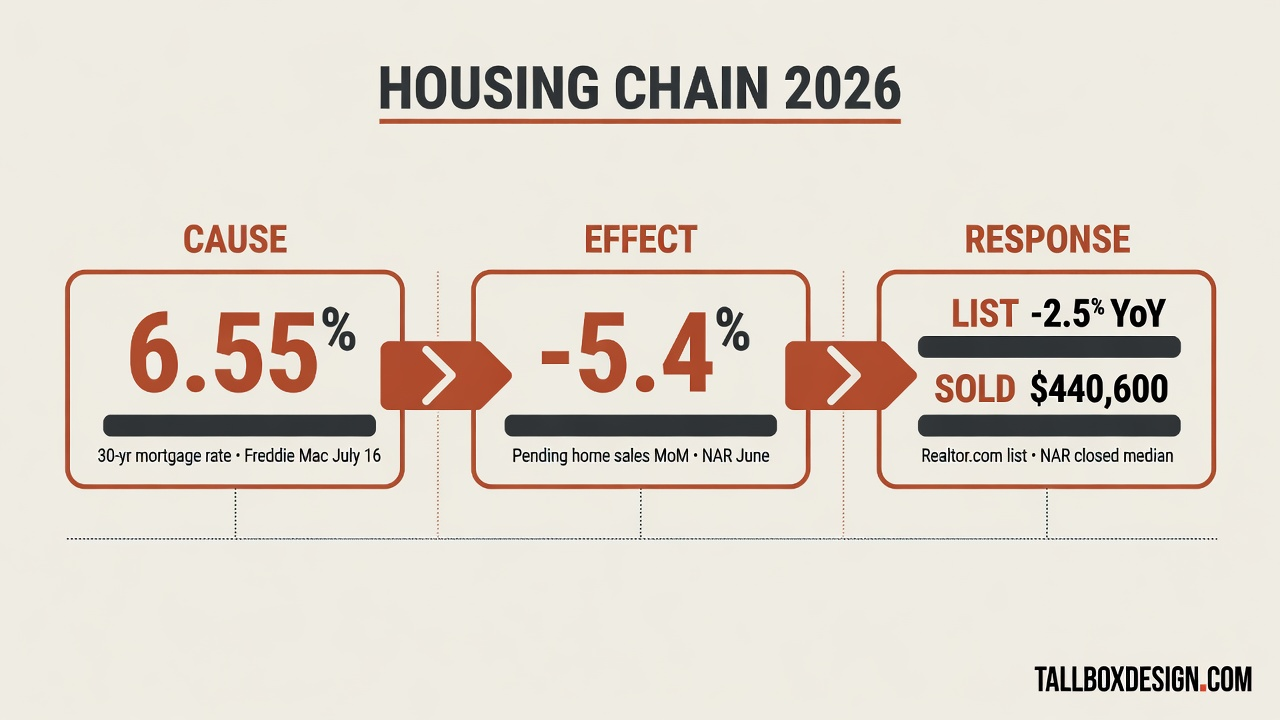
The 30-year fixed mortgage rate averaged 6.55% for the week ending July 16, 2026, the highest weekly reading of the year. That rate spike sits at the center of a mid-July housing chain: pending contracts fell, list prices cut, and closed sale prices still hit a record.
Freddie Mac’s Primary Mortgage Market Survey reports the 6.55% average, up from 6.49% the week before. The National Association of REALTORS® reports June pending home sales down 5.4% month over month. Realtor.com reports June median list prices down 2.5% year over year, while NAR’s closed median sale price reached $440,600. Together the prints describe one market, not three separate stories.
The mid-July 2026 housing chain in one view
One headline misses the sequence. Mortgage cost rises first. Contracts weaken next. Asking prices then adjust while completed sales still clear near record medians for homes priced to today’s payment math.
Source notes: Freddie Mac Primary Mortgage Market Survey (week as of July 16, 2026); National Association of REALTORS® Pending Home Sales (June 2026, released July 16) and Existing-Home Sales (June 2026); Realtor.com June 2026 Monthly Housing Trends Report (list prices). Figures are national averages and indexes, not local quotes.
What does a 6.55% mortgage rate do to homebuyers?
A 6.55% thirty-year rate is the highest weekly average of 2026 on Freddie Mac’s survey and the highest level in nearly a year. A year earlier the average was 6.75%, so this is not peak-cycle panic, but it still shrinks payment room for first-time buyers.
Freddie Mac notes that purchase applications have weakened even as inventory improves. Buyers see more homes, but a higher payment on every dollar of price.

Why did pending home sales fall 5.4% in June 2026?
Pending home sales measure signed contracts, not closings. NAR reports June pending fell 5.4% month over month and 0.3% year over year, with declines in every major U.S. region.
NAR Chief Economist Dr. Lawrence Yun tied the soft contract print to the highest rates in nearly a year and the record national median price. Pending is only a lead for closings; fallout still sits between a signature and a recorded sale.
Regionally, June pending fell in every major region, with the Midwest down 8.9%. Year over year, the Northeast and Midwest still posted small gains while the South and West slipped.
Why do list prices fall while sold prices hit a record?
Realtor.com puts the June 2026 national median list price at $430,000, down 2.5% year over year. That is the steepest annual list drop in its series since 2017 and the eighth straight month of year-over-year declines.
NAR’s closed sales tell a different surface story. Existing-home sales ran at 4.09 million SAAR in June, down 2.4% from May, while the median sale price hit a record $440,600, up 1.8% year over year. Inventory equaled 4.6 months of supply.
Realtor.com reports the median home spent 53 days on market in June, matching last year and ending a 26-month streak of slower times. About 18.8% of listings cut price, still below last year’s share, a sign of earlier realism rather than late panic cuts.
Where are housing list prices still rising or falling hardest?
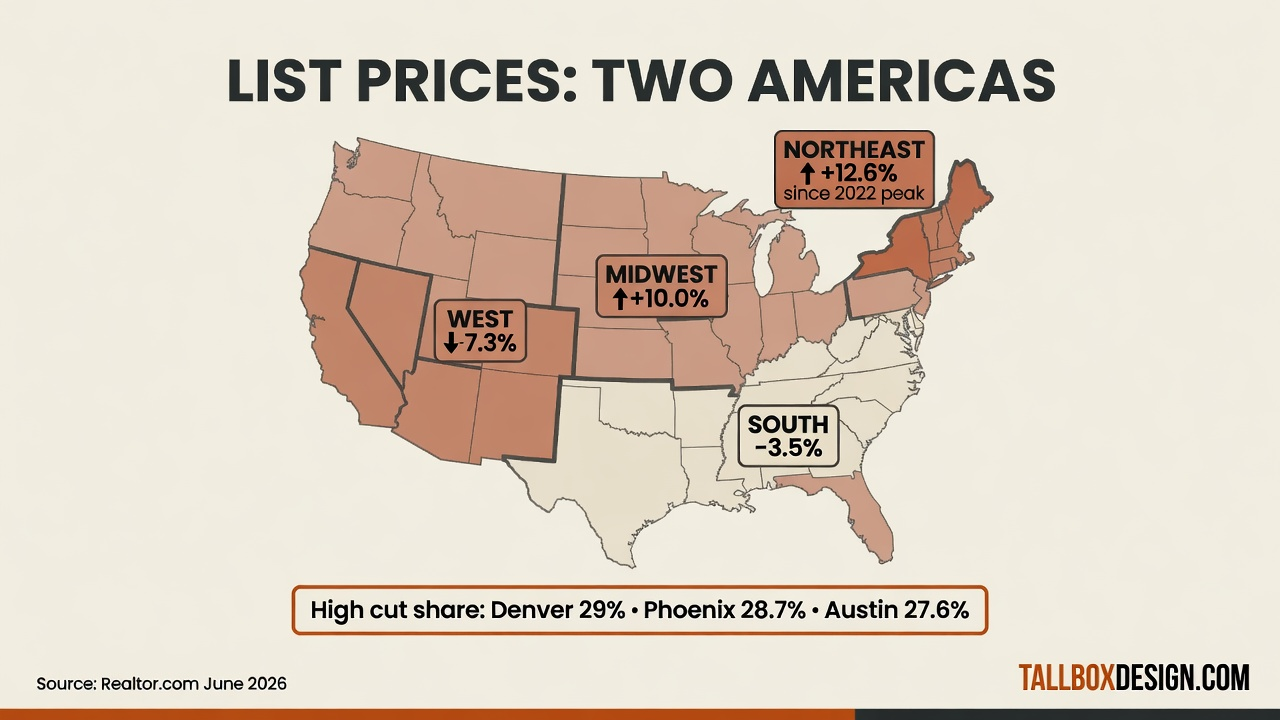
National averages hide two markets. Since list prices peaked in June 2022, Realtor.com shows asks down 7.3% in the West and 3.5% in the South, but up 10.0% in the Midwest and 12.6% in the Northeast.
Price-cut pressure is heaviest in several Sun Belt and Mountain metros: 29.0% of Denver listings, 28.7% of Phoenix listings, and 27.6% of Austin listings showed a cut in June. Austin’s list price per square foot also fell 8.2% year over year.
What should homebuyers do when mortgage rates spike?
A rate spike does not mean wait forever. It means the payment line, not last year’s comps alone, sets the bid.
- ✓Re-run the payment at 6.55% before touring. A house that fit at 6.3% can blow the monthly cap when the average rate moves half a point.
- ✓Watch pending, not only closed sales. Pending is the early signal for the next 30 to 60 days of closings. A −5.4% print is a thinner near-term pipeline.
- ✓Use list-price cuts as leverage, not proof of distress. An 18.8% cut share means some sellers will negotiate. It does not mean every home is a forced sale.
<
What should home sellers do when list prices are cutting?
Sellers face a thinner contract funnel at 6.55%. Homes that still sell match what a payment-constrained buyer will sign on price, condition, and presentation. That pressure is the same one in our guide on how to sell in a buyer-tilted market.
- 1Price to the last 30 days of local comps, not the 2022 peak. National list prices are already −2.5% year over year. Anchoring to an old high only extends days on market.
- 2Lead the listing with payment-era media. Strong photos, a clear floor plan, and a full walkthrough reduce the skip filter. Luxury tiers feel this harder; see how listing images fail when tiers are wrong.
- 3Prefer an honest first ask over a late cut. Realtor.com’s cut share is still below last year because more sellers price closer to reality on day one. A late cut after a stall can look like distress.
- 4For unbuilt or renovated stock, show the finished home. When the camera cannot prove the end state, clear visualization does the work. That is why architectural CGI matters in payment-tight markets, and why the new-home glut rewards finished-product listings.
Sellers who cannot meet the market sometimes pull the home rather than take a cut. That pattern is covered separately in our note on sellers pulling homes off the market.
The takeaway
Read mid-July 2026 as one chain: Freddie Mac’s 6.55% rate raises money cost, NAR’s −5.4% pending print thins contracts, and falling list prices with a record sold median show sellers adjusting the ask while closings still clear high.
Buyers should budget to the rate, not the rumor. Sellers should price and present for the payment-constrained buyer who still signs.